Announcement

Collapse
No announcement yet.

studies don't display the same when reloaded

Collapse
This topic is closed.
X
X
 
  • Filter
  • Time
  • Show
Clear All
new posts

  • studies don't display the same when reloaded

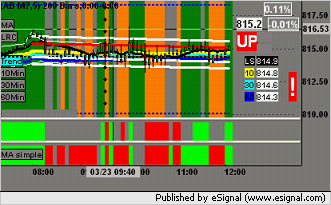
    I hv written a EFS which will change the background color as follows:
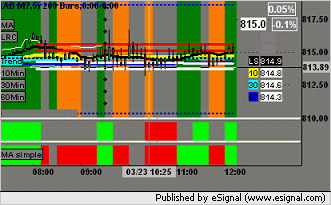
    i) green background when
    - 10min 20EMA is up
    - 30min 20EMA is up
    - 30min 20LSMA is up
    ii) red background when:
    - 10min 20EMA is down
    - 30min 20EMA is down
    - 30min 20LSMA is down

    The problem is that when I reload the chart, the chart doesn't look like the same as it was when run real-time. Would you pls advise why and how can I hv the charts to look the same? Pls note that I hv not set it to compute on close.


    ---------------------------------------------
    var amLib=addLibrary("amStudies.efsLib");
    var EMA_Interval_1 = 10;
    var EMA_Interval_2 = 30;
    var nMALength= 20;
    ....

    function main()
    {

    ....

    vEMA1 = ema(nMALength, inv(EMA_Interval_1));
    vEMA1_previous = ema(nMALength, inv(EMA_Interval_1),-1);
    vLSMA1 = amLib.amLSMA(nMALength, inv(EMA_Interval_1));
    vLSMA1_previous = amLib.amLSMA(nMALength, inv(EMA_Interval_1),-1);
    vEMA2 = ema(nMALength, inv(EMA_Interval_2));
    vLSMA2 = amLib.amLSMA(nMALength, inv(EMA_Interval_2));
    vEMA2_previous = ema(nMALength, inv(EMA_Interval_2),-1);
    vLSMA2_previous = amLib.amLSMA(nMALength, inv(EMA_Interval_2),-1);

    if ( vEMA1>vEMA1_previous && vEMA2>vEMA2_previous && vLSMA2>vLSMA2_previous ) {
    TrendBgColor = StrongUp_Bg_Color;
    } else if ( vEMA1<vEMA1_previous && vEMA2<vEMA2_previous && vLSMA2<vLSMA2_previous ) {
    TrendBgColor = StrongDown_Bg_Color;
    } else {
    TrendBgColor = NormalBgColor;
    }
    setDefaultBarBgColor(TrendBgColor);

    .....

    }
    Last edited by Richard Yu; 03-20-2007, 05:13 PM.

  • #2
    Richard,

    The issue is likely due to the values you are returning to the chart are not the same as what is returned when loading history.

    Remember that when live, the tick before the new bar is the end of the last bar. If this particular calculated value is not returned to the chart before the beginning of the new bar, the chart will not match up when the historical bars are loaded. Depending on how you are determining the background colors and the values used in the conditionals will have an effect on your chart as well.

    Therefore, to see what the problem is, it is essential to see how the calculations are performed in your efs and the logistics of how the chart background is determined as well as how the data is returned to the chart.

    Also, when you mentioned that the chart looks different, I can think of many, many reasons for different looking charts. Exactly what do you mean when you say they look different.

    btw, based on what you posted, you are comparing series values, if that is the case, that may be part of the problem as well.
    Last edited by Guest; 03-20-2007, 06:29 PM.

    Comment


    • #3
      Thank you Stevehare2003.

      My first post already shows the portion related to background display. It doesn't show the entire EFS since the remaining portion is not related.

      The chart looks different after reload. Here I mean that before reload (the chart updates itself real time), the background may show green/red in some areas. But after reload, they show a different colors.

      When there is a strong trend, there is little difference after reload. So it may be due to the reason you explained since when in a strong trend the issue mentioned by you isn't a big issue.

      So is there a way I can change the code so the chart will look same (or at least closer) after reload?

      Comment


      • #4
        Richard,

        You are most welcome. I didn't try to make this partial efs run. So without knowing any more than what you posted, this is my recommendation to solve the issues you are seeing.

        PHP Code:
        var amLib=addLibrary("amStudies.efsLib");
        var 
        EMA_Interval_1 10;
        var 
        EMA_Interval_2 30;
        var 
        nMALength20;
        ....

        var 
        vEMA1;
        var 
        vLSMA1;
        var 
        vEMA2;
        var 
        vLSMA2;
        var 
        bInit false;

        function 
        main()
        {

         ....
         if(!
        bInit){
          
        vEMA1 ema(nMALengthinv(EMA_Interval_1));
          
        //vEMA1_previous = ema(nMALength, inv(EMA_Interval_1),-1);
          
        vLSMA1 amLib.amLSMA(nMALengthinv(EMA_Interval_1));
          
        //vLSMA1_previous = amLib.amLSMA(nMALength, inv(EMA_Interval_1),-1);
          
        vEMA2 ema(nMALengthinv(EMA_Interval_2));
          
        vLSMA2 amLib.amLSMA(nMALengthinv(EMA_Interval_2));
          
        //vEMA2_previous = ema(nMALength, inv(EMA_Interval_2),-1);
          //vLSMA2_previous = amLib.amLSMA(nMALength, inv(EMA_Interval_2),-1);
          
        bInit true;
         }
         if ( 
        vEMA1.getValue(0)>vEMA1.getValue(-1) && vEMA2.getValue(0)>vEMA2.getValue(-1) && vLSMA2.getValue(0)>vLSMA2.getValue(-1)) 
         {
          
        TrendBgColor StrongUp_Bg_Color;
         }
         else if ( 
        vEMA1.getValue(0)<vEMA1.getValue(-1) && vEMA2.getValue(0)<vEMA2.getValue(-1) && vLSMA2.getValue(0)<vLSMA2.getValue(-1)) 
         {
          
        TrendBgColor StrongDown_Bg_Color;
         } 
         else 
         {
          
        TrendBgColor NormalBgColor;
         }
         
        setDefaultBarBgColor(TrendBgColor);

         .....


        Comment


        • #5
          Steve,

          Thank you for your help.

          I hv modified the codes and will test it out real time today.

          One more thing, I hv below 2 lines in my EFS which were omitted previously since they don't seem crucial. After modifying the codes as advised, I get error msg "TypeError: vEMA2.getValue(0) has no properties"
          when I load the EFS in 30min time-frame. Strangely, there is no error in 5min or 10min timeframe. Would you pls advise?


          drawTextAbsolute(7,70,vLSMA1.getValue(0).toFixed(4 ), Color,white, Color.black, Text.BOLD|Text.RELATIVETOTOP|Text.RELATIVETORIGHT, null, 10, "vEMA1value");

          drawTextAbsolute(7,85,vEMA1.getValue(0).toFixed(4) , Color,white, Color.black, Text.BOLD|Text.RELATIVETOTOP|Text.RELATIVETORIGHT, null, 10, "vLSMA1value");
          Last edited by Richard Yu; 03-22-2007, 06:06 AM.

          Comment


          • #6
            Richard,

            You are most welcome. However, whether you realize it or not, you are placing me in a position where I am simply guessing at a solution.

            The error message you are receiving
            One more thing, I hv below 2 lines in my EFS which were omitted previously since they don't seem crucial. After modifying the codes as advised, I get error msg "TypeError: vEMA2.getValue(0) has no properties"
            when I load the EFS in 30min time-frame. Strangely, there is no error in 5min or 10min timeframe. Would you pls advise?


            drawTextAbsolute(7,70,vLSMA1.getValue(0).toFixed(4 ), Color,white, Color.black, Text.BOLD|Text.RELATIVETOTOP|Text.RELATIVETORIGHT, null, 10, "vEMA1value");

            drawTextAbsolute(7,85,vEMA1.getValue(0).toFixed(4) , Color,white, Color.black, Text.BOLD|Text.RELATIVETOTOP|Text.RELATIVETORIGHT, null, 10, "vLSMA1value");
            ... indicates to me that the error is prior to where vEMA2 is declared within the bInit conditional. Once declared, vEMA2.getValue(0) should, as a minimum, return a null. This variable is not associated with the other steps you just provided.

            If my last guess doesn't help, please post a complete version of your efs that demonstrates the issue(s) you are having and I will help you remedy the errors in your code. Also include information on the different time templates your efs is using (which btw, may be why you are having your "Strange" problem).

            Comment


            • #7
              Hi Steve,

              Pls see below for the code.

              I hv tried it real-time. After reload, the chart still looks different (from the one before reload). Maybe I hv not implemented your code correctly. thx.


              ---------------------------------------------
              var amLib = addLibrary("amStudies.efsLib");

              var thisSymbol;
              var symbol;
              var thisInterval;
              var nMALength= 20;
              var vLSMA_vEMA_Diff_Pct = 0.1;
              var bInit = false;
              var no_of_digits=4;

              var NormalBgColor = Color.RGB(127,127,127);
              var Up_Bg_Color = Color.green;
              var Down_Bg_Color = Color.RGB(255,128,0);

              var EMA_Interval_1 = 10;
              var EMA_Interval_2 = 30;
              var EMA_Interval_3 = 60;
              var EMA1_Color = Color.yellow;
              var EMA2_Color = Color.cyan;
              var EMA3_Color = Color.blue;
              var EMA4_Color = Color.fushcia;
              var LSMA_Color = Color.black;

              function preMain()
              {
              setPriceStudy(true);
              setStudyTitle("test");
              setIntervalsBackfill(true);
              //setComputeOnClose(true);


              setCursorLabelName("60m EMA",0);
              setDefaultBarThickness(3,0);
              setDefaultBarFgColor(EMA3_Color,0);
              setCursorLabelName("30m EMA",1);
              setDefaultBarThickness(3,1);
              setDefaultBarFgColor(EMA2_Color,1);
              setCursorLabelName("10min EMA",2);
              setDefaultBarThickness(4,2);
              setDefaultBarFgColor(EMA1_Color,2);
              setCursorLabelName("10min LSMA",3);
              setDefaultBarThickness(3,3);
              setDefaultBarFgColor(LSMA_Color,3);


              }

              function main()
              {
              if( getBarState() == BARSTATE_ALLBARS ) {

              thisInterval = getInterval();
              thisSymbol = getSymbol();
              symbol = thisSymbol.substring(0, 2);

              switch (symbol) {
              case "YM":
              no_of_digits=0;
              break;
              case "AB":
              case "YG":
              no_of_digits=1;
              break;
              case "NQ":
              case "ES":
              no_of_digits=2;
              break;
              case "QM":
              case "QG":
              no_of_digits=3;
              break;
              case "ZE":
              no_of_digits=4;
              break;
              default:
              }

              drawTextAbsolute(4, 70, "LS", Color.white, Color.black,
              Text.BOLD|Text.LEFT|Text.RELATIVETOTOP|Text.RELATI VETORIGHT, null, 10, "LSMA1ColorCode");
              drawTextAbsolute(4, 85, "10", Color.black, EMA1_Color,
              Text.BOLD|Text.LEFT|Text.RELATIVETOTOP|Text.RELATI VETORIGHT, null, 10, "EMA1ColorCode");
              drawTextAbsolute(4, 100, "30", Color.black, EMA2_Color,
              Text.BOLD|Text.LEFT|Text.RELATIVETOTOP|Text.RELATI VETORIGHT, null, 10, "EMA2ColorCode");
              drawTextAbsolute(4, 115, "60", Color.black, EMA3_Color,
              Text.BOLD|Text.LEFT|Text.RELATIVETOTOP|Text.RELATI VETORIGHT, null, 10, "EMA3ColorCode");
              }


              if(!bInit) {
              vEMA1 = ema(nMALength, inv(EMA_Interval_1));
              vEMA2 = ema(nMALength, inv(EMA_Interval_2));
              vEMA3 = ema(nMALength, inv(EMA_Interval_3));
              vLSMA1 = amLib.amLSMA(nMALength, inv(EMA_Interval_1));
              vLSMA2 = amLib.amLSMA(nMALength, inv(EMA_Interval_2));
              bInit=true;
              }

              if ( vEMA1.getValue(0)>=vEMA1.getValue(-1) &&
              vEMA2.getValue(0)>=vEMA2.getValue(-1) && vLSMA2.getValue(0)>=vLSMA2.getValue(-1)
              )
              TrendBgColor = Up_Bg_Color;
              else if ( vEMA1.getValue(0)<=vEMA1.getValue(-1) &&
              vEMA2.getValue(0)<=vEMA2.getValue(-1) && vLSMA2.getValue(0)<=vLSMA2.getValue(-1)
              )
              TrendBgColor = Down_Bg_Color;
              else
              TrendBgColor = NormalBgColor;

              setDefaultBarBgColor(TrendBgColor);

              drawTextAbsolute(7, 70, vLSMA1.getValue(0).toFixed(no_of_digits), Color.white, Color.black,
              Text.BOLD|Text.LEFT|Text.RELATIVETOTOP|Text.RELATI VETORIGHT, null, 10, "vLSMA1Trend");
              drawTextAbsolute(7, 85, vEMA1.getValue(0).toFixed(no_of_digits), Color.black, Color.white,
              Text.BOLD|Text.LEFT|Text.RELATIVETOTOP|Text.RELATI VETORIGHT, null, 10, "EMA1Trend");
              drawTextAbsolute(7, 100, vEMA2.getValue(0).toFixed(no_of_digits), Color.black, Color.white,
              Text.BOLD|Text.LEFT|Text.RELATIVETOTOP|Text.RELATI VETORIGHT, null, 10, "EMA2Trend");
              drawTextAbsolute(7, 115, vEMA3.getValue(0).toFixed(no_of_digits), Color.black, Color.white,
              Text.BOLD|Text.LEFT|Text.RELATIVETOTOP|Text.RELATI VETORIGHT, null, 10, "EMA3Trend");


              if (thisInterval=="5" || thisInterval=="10")
              return new Array (vEMA3.getValue(0), vEMA2.getValue(0), vEMA1.getValue(0), vLSMA1.getValue(0));
              else if (thisInterval=="30")
              return new Array (vEMA3.getValue(0), vEMA2.getValue(0), null, null);


              }

              Comment


              • #8
                I have noticed that for a typical day of ES #F my live data total Volume value is 6-8% less than the Volume total value when the day's data is reloaded. My loss seems to be distributed thru the whole day. When a bar's high/low/open/close price is lost it will appear as a visible chart difference.

                This live vs history difference could be explained as lost packets and I can't prove otherwise. However, I remember a forum post from eSignal that stated data is now timestamped before transmission instead of when it arrives. I have never seen an explaination of how live data for a bar is handled when the bar is closed before some of it's live data arrives.

                I have a fast computer with a broadband connection the gives between 14 - 20 Mbps download speed. My ISP has checked my line/modem and their tests rate my connection as excellent. No other application are running on the eSignal computer and I only use a handful of eSignal symbols.

                Comment


                • #9
                  Hi Steve,

                  Pls see below charts for their look before and after reload

                  - before reload (ie, running real time)


                  - after reload
                  Last edited by Richard Yu; 03-23-2007, 09:15 AM.

                  Comment


                  • #10
                    Hi Richard,

                    Thanks for posting the code but there is one more thing. What is the time template that you are using for your chart(s). I believe this could be an issue especially with error you are receiving (i.e. you are simply not loading enough data to support calculations with the longer duration timeframe).

                    To check this, I need to have you to check and provide the details of the time templates that are being used when you are running the different timeframe charts.

                    I just noticed you posted some images while I was putting this post together. I will take a look at this in more detail after I exit the "Post Reply" screen. I still need the time template and chart timeframe info.

                    Comment


                    • #11
                      Hi Steve,

                      I load it on 5-min chart with 200 bars of data. thx.

                      Comment


                      • #12
                        Hi Richard,

                        Ok, therein may be part of your problem. The 30 minute moving average will return a null value until it has 20 bars (your ma length) to perform the calculation. This requires over 600 minutes of data. Up to that point, the null data values are evaluated as false in your conditionals edit - (or true if comparing if(null==null) or if(null>=null) ).

                        I believe if you reload your efs with the right click pullup menu, you will keep the number of bars (200 + accumulated) that are loaded on the chart.

                        However, if you reload eSignal or otherwise reset the chart back to 200 bars), you will lose all but the last 200 bars, resulting in the 20 minute ma tests being false for the first 120 bars on the chart.

                        For now, please either modify your time template or create a new time template to load 1000 bars. Then we can see if this is contributing to the issues you are seeing.
                        Last edited by Guest; 03-23-2007, 10:01 AM.

                        Comment


                        • #13
                          Hi Richard,

                          I went ahead and fully traced your efs, and I want to provide you with what I have done.

                          Regarding the length or the number of bars loaded, I will have to retract my statement regarding the null values. They are in fact defined and not null.

                          Having looked at this further, I believe I know what the issue is. It has to do with how the different timeframes are processed when live and when the historical values are being processed.

                          When the historical bars are reloaded, you are looking at each of the studies values at the end of their respective bars. However, when live, you are using their intermediate values which will change tick to tick. Sorry it took so long to figure this out.

                          To remedy this, you will have to reference the last two bars in your conditionals. Specifically, instead of referencing the current bar that is still developing and comparing against the last completed bar, bar (0) and (-1), you will have to reference the last two completed bars, (-1) and (-2).

                          I will look at this further, but I believe this is correct.

                          I am attaching your efs ( I did not make the modification regarding the bar indexes), see if you can follow the program flow. This writes the trace steps to a file that you should be able to access by clicking the trace button on the screen.


                          PHP Code:
                          var amLib addLibrary("amStudies.efsLib");

                          var 
                          thisSymbol;
                          var 
                          symbol;
                          var 
                          thisInterval;
                          var 
                          nMALength20;
                          var 
                          vLSMA_vEMA_Diff_Pct 0.1;
                          var 
                          bInit false;
                          var 
                          no_of_digits=4;

                          var 
                          NormalBgColor Color.RGB(127,127,127);
                          var 
                          Up_Bg_Color Color.green;
                          var 
                          Down_Bg_Color Color.RGB(255,128,0);

                          var 
                          EMA_Interval_1 10;
                          var 
                          EMA_Interval_2 30;
                          var 
                          EMA_Interval_3 60;
                          var 
                          EMA1_Color Color.yellow;
                          var 
                          EMA2_Color Color.cyan;
                          var 
                          EMA3_Color Color.blue;
                          var 
                          EMA4_Color Color.fushcia;
                          var 
                          LSMA_Color Color.black;

                          function 
                          preMain()
                          {
                           
                          setPriceStudy(true);    
                           
                          setStudyTitle("test");
                           
                          setIntervalsBackfill(true);
                           
                          //setComputeOnClose(true); 


                          setCursorLabelName("60m EMA",0);
                           
                          setDefaultBarThickness(3,0);
                           
                          setDefaultBarFgColor(EMA3_Color,0);
                           
                          setCursorLabelName("30m EMA",1);
                           
                          setDefaultBarThickness(3,1);
                           
                          setDefaultBarFgColor(EMA2_Color,1);
                           
                          setCursorLabelName("10min EMA",2);
                           
                          setDefaultBarThickness(4,2);
                           
                          setDefaultBarFgColor(EMA1_Color,2);
                           
                          setCursorLabelName("10min LSMA",3);
                           
                          setDefaultBarThickness(3,3);
                           
                          setDefaultBarFgColor(LSMA_Color,3);


                          }
                          var 
                          bCount1 1;
                          var 
                          bCount2 1;
                          var 
                          bCount3 1;
                          function 
                          main()


                           if(!
                          bInit) {
                            
                          trace("54: bInit = "+bInit);
                            
                          vEMA1 ema(nMALengthinv(EMA_Interval_1));trace("55: vEMA1 = "+vEMA1);
                            
                          vEMA2 ema(nMALengthinv(EMA_Interval_2));trace("56: vEMA2 = "+vEMA2);
                            
                          vEMA3 ema(nMALengthinv(EMA_Interval_3));trace("57: vEMA3 = "+vEMA3);
                            
                          vLSMA1 amLib.amLSMA(nMALengthinv(EMA_Interval_1));trace("58: vLSMA1 = "+vLSMA1);
                            
                          vLSMA2 amLib.amLSMA(nMALengthinv(EMA_Interval_2));trace("59: vLSMA2 = "+vLSMA2);
                            
                          bInit=true;   
                            
                          trace("61: bInit = "+bInit);
                           }  
                           if( 
                          getBarState() == BARSTATE_ALLBARS ) {
                            
                            
                          thisInterval getInterval();trace("65: thisInterval = "+thisInterval);
                            
                          thisSymbol getSymbol();trace("66: thisSymbol = "+thisSymbol);
                            
                          symbol thisSymbol.substring(02);trace("67: symbol = "+symbol);
                            
                            switch (
                          symbol) {
                             case 
                          "YM":
                               
                          no_of_digits=0;trace("71: symbol = "+symbol+" no_of_digits = "+no_of_digits);
                               break;
                             case 
                          "AB":
                             case 
                          "YG":
                               
                          no_of_digits=1;trace("75: symbol = "+symbol+" no_of_digits = "+no_of_digits);
                               break;
                             case 
                          "NQ":
                             
                          trace("78: ... symbol = "+symbol+" no_of_digits = "+no_of_digits);
                             case 
                          "ES":
                               
                          no_of_digits=2;trace("80: symbol = "+symbol+" no_of_digits = "+no_of_digits);
                               break;
                             case 
                          "QM":
                             
                          trace("83: ... symbol = "+symbol+" no_of_digits = "+no_of_digits);
                             case 
                          "QG":
                               
                          no_of_digits=3;trace("85: symbol = "+symbol+" no_of_digits = "+no_of_digits);
                               break;
                             case 
                          "ZE":
                               
                          no_of_digits=4;trace("88: symbol = "+symbol+" no_of_digits = "+no_of_digits);
                               break;  
                             default:
                             
                          trace("91:... default.... symbol = "+symbol+" no_of_digits = "+no_of_digits);
                            }
                            
                            
                          drawTextAbsolute(470"LS"Color.whiteColor.black,
                              
                          Text.BOLD|Text.LEFT|Text.RELATIVETOTOP|Text.RELATIVETORIGHTnull10"LSMA1ColorCode");
                            
                          drawTextAbsolute(485"10"Color.blackEMA1_Color,
                              
                          Text.BOLD|Text.LEFT|Text.RELATIVETOTOP|Text.RELATIVETORIGHTnull10"EMA1ColorCode");
                            
                          drawTextAbsolute(4100"30"Color.blackEMA2_Color,
                              
                          Text.BOLD|Text.LEFT|Text.RELATIVETOTOP|Text.RELATIVETORIGHTnull10"EMA2ColorCode");
                            
                          drawTextAbsolute(4115"60"Color.blackEMA3_Color,
                              
                          Text.BOLD|Text.LEFT|Text.RELATIVETOTOP|Text.RELATIVETORIGHTnull10"EMA3ColorCode");
                           }

                            
                           if ( 
                          vEMA1.getValue(0)>=vEMA1.getValue(-1) &&
                           
                          vEMA2.getValue(0)>=vEMA2.getValue(-1) && vLSMA2.getValue(0)>=vLSMA2.getValue(-1
                           )
                           
                          TrendBgColor Up_Bg_Color;
                           else if ( 
                          vEMA1.getValue(0)<=vEMA1.getValue(-1) &&
                           
                          vEMA2.getValue(0)<=vEMA2.getValue(-1) && vLSMA2.getValue(0)<=vLSMA2.getValue(-1)
                           )
                           
                          TrendBgColor Down_Bg_Color;
                           else
                           
                          TrendBgColor NormalBgColor;

                           var 
                          test1 = new Array();
                           var 
                          n=0;
                           
                          test1[n++] = vEMA1.getValue(0);
                           
                          test1[n++] = vEMA1.getValue(-1);
                           
                          test1[n++] = vEMA1.getValue(0)>=vEMA1.getValue(-1);
                           
                          test1[n++] = vEMA2.getValue(0);
                           
                          test1[n++] = vEMA2.getValue(-1);
                           
                          test1[n++] = vEMA2.getValue(0)>=vEMA2.getValue(-1);
                           
                          test1[n++] = vLSMA2.getValue(0);
                           
                          test1[n++] = vLSMA2.getValue(-1);
                           
                          test1[n++] = vLSMA2.getValue(0)>=vLSMA2.getValue(-1);
                           var 
                          cond1 test1[n++] = ( vEMA1.getValue(0)>=vEMA1.getValue(-1) && vEMA2.getValue(0)>=vEMA2.getValue(-1) && vLSMA2.getValue(0)>=vLSMA2.getValue(-1) );
                           
                          test1[n] = Up_Bg_Color;
                           var 
                          tmp =comma "";
                           var 
                          n;
                           do{
                            
                          tmp+=(comma test1[k-n]);
                            
                          comma ", ";
                           }while(
                          n--);
                           
                          trace("135: conditional 1 = "+cond1+" ... "+tmp);

                           var 
                          test2 = new Array();
                           var 
                          n=0;
                           
                          test2[n++] = vEMA1.getValue(0);
                           
                          test2[n++] = vEMA1.getValue(-1);
                           
                          test2[n++] = vEMA1.getValue(0)<=vEMA1.getValue(-1);
                           
                          test2[n++] = vEMA2.getValue(0);
                           
                          test2[n++] = vEMA2.getValue(-1);
                           
                          test2[n++] = vEMA2.getValue(0)<=vEMA2.getValue(-1);
                           
                          test2[n++] = vLSMA2.getValue(0);
                           
                          test2[n++] = vLSMA2.getValue(-1);
                           
                          test2[n++] = vLSMA2.getValue(0)<=vLSMA2.getValue(-1);
                           var 
                          cond2 test2[n++] = ( vEMA1.getValue(0)<=vEMA1.getValue(-1) && vEMA2.getValue(0)<=vEMA2.getValue(-1) && vLSMA2.getValue(0)<=vLSMA2.getValue(-1) );
                           
                          test2[n] = Up_Bg_Color;
                           var 
                          tmp =comma "";
                           var 
                          n;
                           do{
                            
                          tmp+=(comma test2[k-n]);
                            
                          comma ", ";
                           }while(
                          n--);
                           
                          trace("156: conditional 2 = "+cond2+" ... "+tmp);

                           
                          trace("158: TrendBgColor  = "+TrendBgColor );


                           var 
                          nState1 getBarStateInterval(EMA_Interval_1);
                           var 
                          nState2 getBarStateInterval(EMA_Interval_2);
                           var 
                          nState3 getBarStateInterval(EMA_Interval_3);

                           if (
                          nState1 == BARSTATE_NEWBAR) {
                            
                          bCount1++;
                            
                          trace("167: EMA_Interval_1 new bar, barcount1   = "+bCount1);trace("167: ");trace("167: ");
                           }

                           if (
                          nState2 == BARSTATE_NEWBAR) {
                            
                          bCount2++;
                            
                          trace("172: EMA_Interval_2 new bar, barcount2   = "+bCount2);trace("172: ");trace("172: ");
                           }
                           if (
                          nState3 == BARSTATE_NEWBAR) {
                            
                          bCount3++;
                            
                          trace("176: EMA_Interval_3 new bar, barcount3   = "+bCount3);trace("176: ");trace("176: ");
                           }

                           
                          setBarBgColor(TrendBgColor);

                           
                          drawTextAbsolute(770vLSMA1.getValue(0).toFixed(no_of_digits), Color.whiteColor.black,
                           
                          Text.BOLD|Text.LEFT|Text.RELATIVETOTOP|Text.RELATIVETORIGHTnull10"vLSMA1Trend");    
                           
                          drawTextAbsolute(785vEMA1.getValue(0).toFixed(no_of_digits), Color.blackColor.white,
                           
                          Text.BOLD|Text.LEFT|Text.RELATIVETOTOP|Text.RELATIVETORIGHTnull10"EMA1Trend");
                           
                          drawTextAbsolute(7100vEMA2.getValue(0).toFixed(no_of_digits), Color.blackColor.white,
                           
                          Text.BOLD|Text.LEFT|Text.RELATIVETOTOP|Text.RELATIVETORIGHTnull10"EMA2Trend");
                           
                          drawTextAbsolute(7115vEMA3.getValue(0).toFixed(no_of_digits), Color.blackColor.white,
                           
                          Text.BOLD|Text.LEFT|Text.RELATIVETOTOP|Text.RELATIVETORIGHTnull10"EMA3Trend");

                              
                              if (
                          thisInterval=="5" || thisInterval=="10")
                                  return new Array (
                          vEMA3.getValue(0), vEMA2.getValue(0), vEMA1.getValue(0), vLSMA1.getValue(0));    
                              else if (
                          thisInterval=="30")
                                  return new Array (
                          vEMA3.getValue(0), vEMA2.getValue(0), nullnull);
                              

                          }


                          //########### trace section required to be copied complete ##############
                          var traceon true;// previous tracefile is overwritten if this is true
                          var nStudy "Richard.txt";// -  name to be used to name tracefile and button - ensure it is a .txt file to ensure notepad auto opens it..
                          var tCount 0;

                          var 
                          tFile = new File(nStudy);
                          function 
                          trace(data1){
                           switch(
                          traceon){
                            case (
                          true): // script is initializing or re-initializing
                             
                          traceon false;
                             
                          tFile.open("wt+");//opens and overwrites previous file
                             
                          break;
                            case (
                          false): //the first tick of a new bar has arrived 
                             
                          tFile.open("at+");
                             break;
                            default: 
                           } 
                           
                          tFile.writeln(data1);
                           
                          tFile.flush();
                           if (
                          trace.caller.name!="preMain")tButton();//call to the button that allows opening text file
                           
                          trace trace1;
                          }
                          function 
                          trace1(data1){
                           
                          tFile.writeln(data1);
                           
                          tFile.flush();
                           if ((
                          tCount++>10) && (trace1.caller.name!="postMain"))tButton();//call to the button that allows opening text file
                          }

                          function 
                          tButton(){
                           var 
                          flags = (Text.RELATIVETOLEFT Text.RELATIVETOBOTTOM|Text.FRAME);
                           var 
                          nText = (" click here to see the "+nStudy+" file " +( "@URL="+getFormulaOutputRoot()+nStudy));
                           
                          drawTextPixel(5030nText,  Color.rednullflags"Comic Sans MS"13,("trace11"));
                           
                          tCount 0;
                          }
                          function 
                          postMain() {
                           if(
                          tFile.isOpen())tFile.close();//used for trace utility
                          }
                          //########## section required to be copied complete ################ 
                          Last edited by Guest; 03-23-2007, 12:16 PM.

                          Comment


                          • #14
                            Hi Steve,

                            Without changing the EFS I tried loading in into a 10 minute AB #F, 24 hour 60 day template and I'm also getting the error on line 181.

                            What's strange is that in trace I'm seeing null values for the variable causing the error on line 181. It appears there is sufficient data to initialize those variables so I have no idea why they are still null.

                            Glen
                            Glen Demarco
                            [email protected]

                            Comment


                            • #15
                              Hi Steve,

                              I prefer to use getValue(0) and getValue(-1) instead of getValue(-1) and getValue(-2) to avoid the lag.

                              So I hv changed the code to use high and low value of the bar which should remain the same no matter real-time or not. I will test it out next wk.


                              if ( vEMA1.getValue("high",0)>=vEMA1.getValue("high",-1) &&

                              vEMA2.getValue("high",0)>=vEMA2.getValue("high",-1) && vLSMA2.getValue("high",0)>=vLSMA2.getValue("high",-1)

                              )

                              TrendBgColor = Up_Bg_Color;

                              else if ( vEMA1.getValue("low",0)<=vEMA1.getValue("low",-1) &&

                              vEMA2.getValue("low",0)<=vEMA2.getValue("low",-1) && vLSMA2.getValue("low",0)<=vLSMA2.getValue("low",-1)

                              )
                              Last edited by Richard Yu; 03-24-2007, 03:13 AM.

                              Comment

                              Working...
                              X