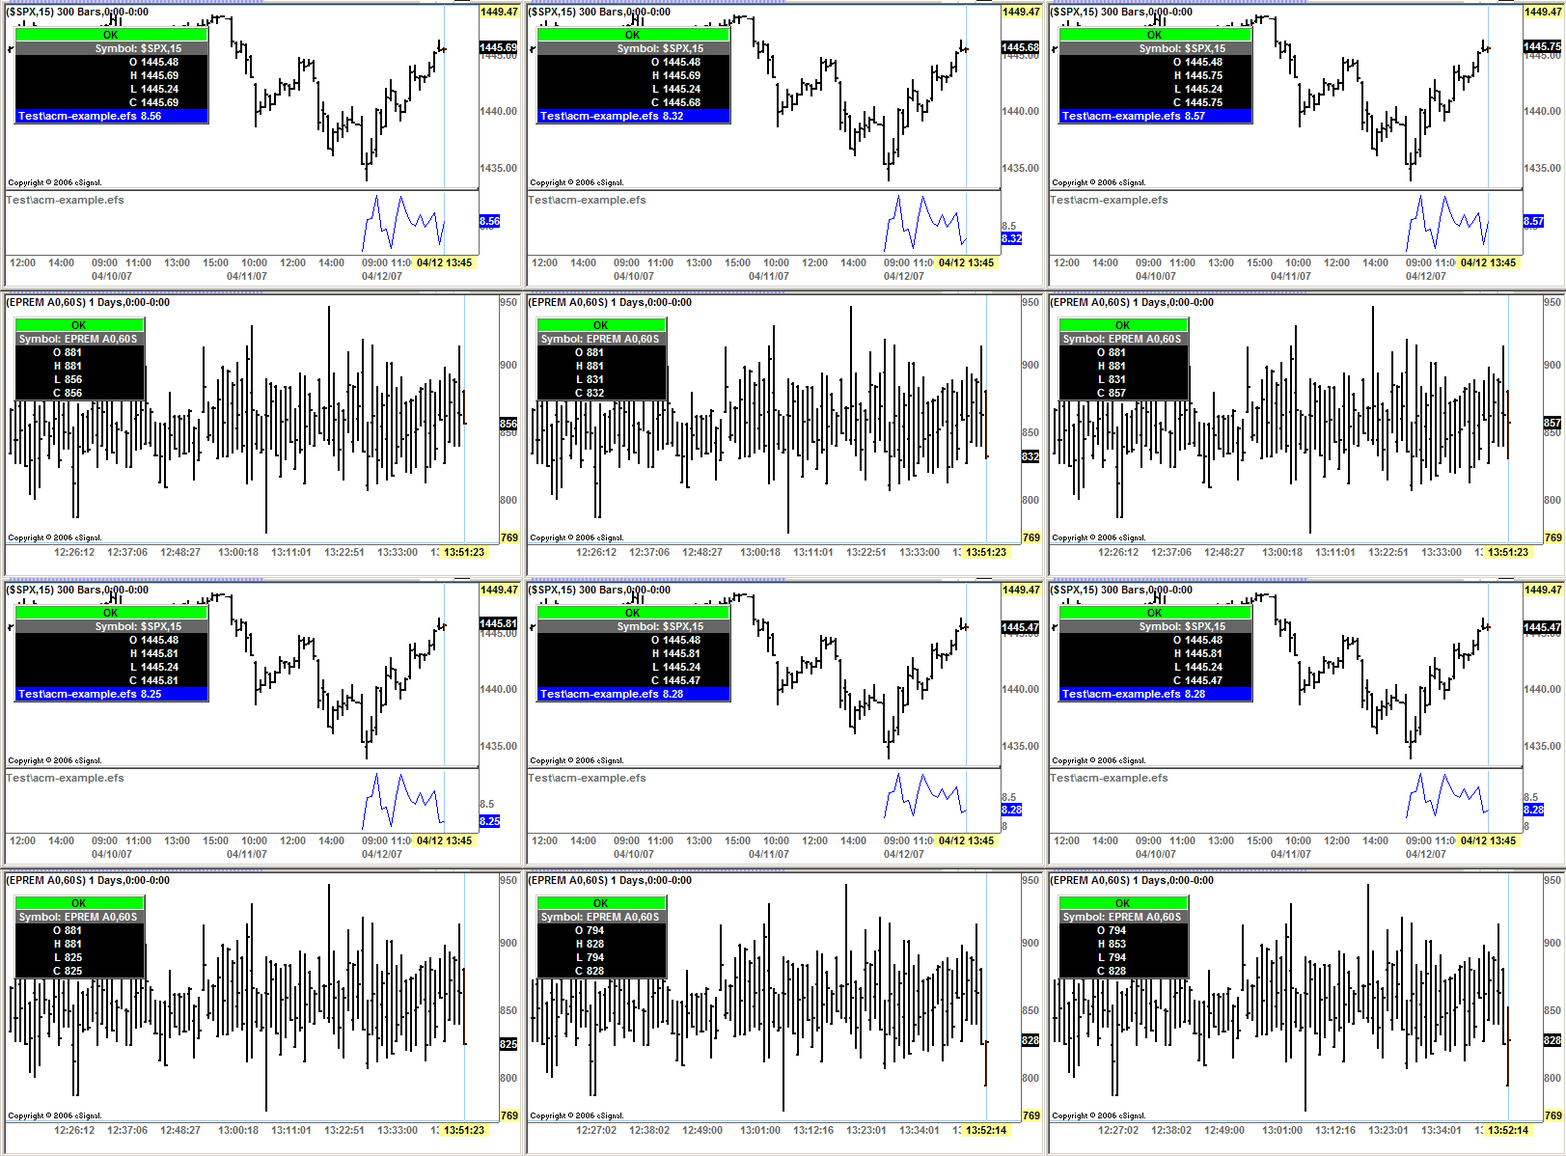
It has been mentioned in various posts that while all ticks are picked up in a tick chart, some ticks are missed when one minute bars are employed. I think this may be the case with imported values as well. For example, within a 60s tick chart of the emini (es #f) I would like to incorporate into a study the tick by tick close of EPREM A0 but find if I construct an internal function within which I assign a variable the close of EPREM A0, e.g.
function calc() {
epremclose = close(0, sym("EPREM A0"));
return epremclose;
}
and then pass and plot the value of epremclose to the main() using efsInternal(), that this plot does not update as often as do the values of EPREM A0 can be seen doing if I open a 60s tick chart of EPREM A0 off to the side for comparison purposes. I tried including an interval specification in the internal function, i.e.
epremclose = close(0, sym("EPREM A0, inv(60s)"));
but still found that far from all EPREM A0 ticks were being processed in the es #f chart study. So my question is, how can a study used in a 60s chart of the emini be designed so as to plot ALL the tick by tick changes in EPREM A0? Thanks for any suggestions.
Mike

Comment