Announcement

Collapse
No announcement yet.

Modifying Lines and Labels efs

Collapse
X
 
  • Filter
  • Time
  • Show
Clear All
new posts

  • Modifying Lines and Labels efs

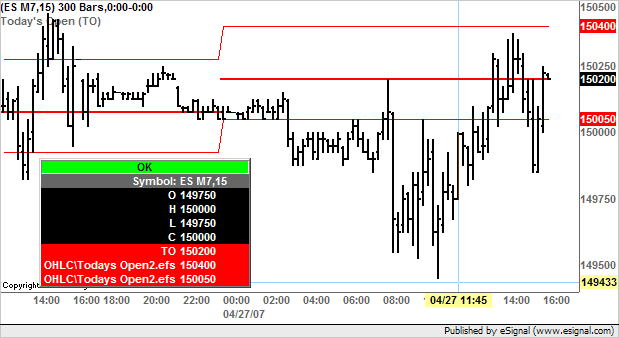
    Could someone offer suggestions on how to modify the attached efs so that it can show lines and labels with the Opening Price and various offsets that can be edited under "Study Properties"?
    e.g. S&P emini Open 1493.75
    Lines & Labels at Open + 2, Open + 4, Open - 1.5, Open - 3.
    Any help would be greatly appreciated.

    Eric
    Attached Files

  • #2
    Eric
    I would suggest using Todays Open.efs [which is in the OHLC folder of Formulas] rather than LinesLabels.efs as it is considerably easier to adapt to what you are trying to accomplish.
    Here below is the main function of that efs modified in the simplest possible way to plot the Open and two lines at user defined point offsets. By default these are set at Open+2 and Open-1.5 but can be modified through Edit Studies. The result of this modification is shown in the screenshot enclosed below
    PHP Code:
    function main(Offset1Offset2) {//add the parameter names in the main definition
     
        
    if(isMonthly() || isWeekly() || isDaily())
        return;
        
        if(
    Offset1==nullOffset1 2; else Offset1 Offset1;//initialize the parameters and set default
        
    if(Offset2==nullOffset2 = -1.5; else Offset2 Offset2;//initialize the parameters and set default
        
        
    if(bInit == false){
            
    xOpen  open(inv("D"));
            
    bInit true;
        }
        
        var 
    vOpen  xOpen.getValue(0);//replaced the series with the value (see Note1 below)
        
    var Line1  xOpen.getValue(0)+(Offset1);//see Note2 below
        
    var Line2  xOpen.getValue(0)+(Offset2);
        
        return new Array (
    vOpenLine1Line2);//modified return statement to return an array
    }
    //Note1: Because the value of the Open does not change during the day it actually is not necessary 
    //       to return the series as no constant synchronization of the plot is required
    //Note2: These lines are written like this so that the user defined price offset can be a positive 
    //       or negative number 
    Using the above as an example you should be able to easily add other lines at the desired offsets.
    Once you have completed that and you have verified that all the lines are plotting at the appropriate levels then add the required statements in preMain to assign the Cursor Label names, colors, types and thickness of the plots. Use the existing one as an example.
    If you encounter any problems post the efs as you have written it and I or someone else can assist you in fixing it.
    Alex

    Comment


    • #3
      Alex,

      Thanks for the detailed reply.
      I've added extra lines to the script but I can't get the lines to appear for the current trading day.
      Any idea as to where the problem may be ???

      Eric
      Attached Files

      Comment


      • #4
        Eric
        Your script appears to be working at my end (see enclosed screenshot)
        Alex

        Comment


        • #5
          Hello Alex,

          I would like the script to show lines for the current trading day only. I have no idea how to go about it though.

          Eric

          Comment


          • #6
            Eric
            See the solution provided in this thread
            Alex

            Comment


            • #7
              Alex,

              Many thanks - I really appreciate the support !!!

              Eric

              Comment


              • #8
                Eric
                You are most welcome
                Alex

                Comment

                Working...
                X