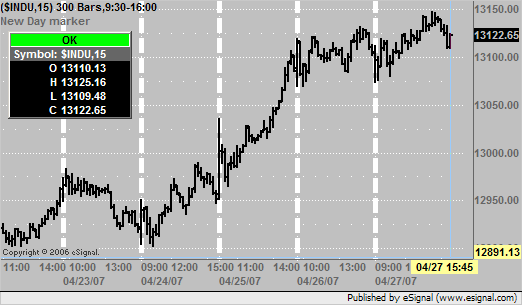
I would like to add a vertical new day marker to the chart.
Somehow the marker once appears once. For example, today is 27/4 and there is a marker for the 26/4-to-27/4 transition but none for the 25/4-to-26/4 transition). Would someone advise?
function preMain() {
setPriceStudy(true);
setStudyTitle("New Day marker");
setShowCursorLabel(false);
var fp1 = new FunctionParameter("nThickness", FunctionParameter.NUMBER);
fp1.setName("Thickness");
fp1.setLowerLimit(1);
fp1.setDefault(5);
var fp2 = new FunctionParameter("cColor", FunctionParameter.COLOR);
fp2.setName("Color");
fp2.setDefault(Color.white);
}
function main(nThickness, cColor) {
var vInt = getInterval();
if (vInt == "D" || vInt == "W" || vInt == "M") return;
if ( getBarState() == BARSTATE_NEWBAR ) {
if ( getDay() != getDay(-1) && getDay(-1) != null )
drawLineRelative(0, 0, 0, 15000, PS_DASH, nThickness, cColor, "HLine");
}
return;
}

Comment