 Tweet
Tweet
Basic question. Other programs I've used when you choose a 50 or 200 DAY MA - the word "day" is actually a choice. E-signal doesn't have that as a choice, it just says "length". How do I know I'm choosing 50 DAY MA, not a 50 min MA. I want to put the 50/200 day MA on my minute charts. Thanks for your help.
-
Last edited by theking2000; 05-01-2007, 10:32 AM. -
theking2000
All the studies included in Basic Studies are calculated using only the chart interval ie. a moving average of Length 50 is based on 50 bars of the interval plotted on the chart.
If you want to plot studies based on intervals different from the one in the chart (for example a 50 Day moving average on a 60 minute chart) then you need to use the EFS studies which are included in the EFS2 Custom folder of Formulas. Those studies can be based on external intervals (and in some cases also external symbols) ie intervals and/or symbols that are different from the one being charted
As you apply any one of those formulas to the chart you will be prompted for the parameters. In the Interval parameter insert a D or d which stands for Daily.
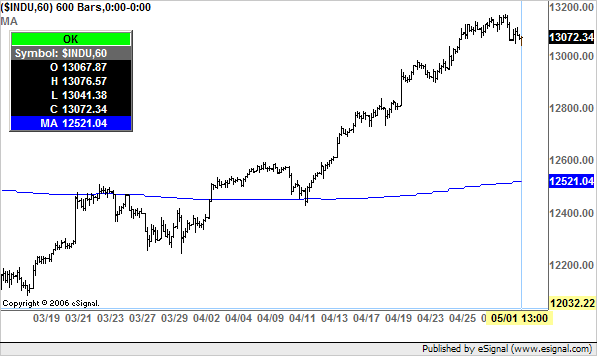
In the screenshot enclosed below you can see a 50 "day" moving average plotted on a 60 minute chart
Alex
-
Thanks, Alex. I'll check that out tonight and let you know if I have any further questions. If I do, do I have to start another thread or simply reply to this one?Comment
-
theking2000
You are most welcome
It depends. If the questions are related to the topic of this thread then reply to the thread otherwise start a new one.If I do, do I have to start another thread or simply reply to this one?
AlexComment
Comment