Announcement

Collapse
No announcement yet.

Clarifications on [series] param in setBarBgColor

Collapse
X
 
  • Filter
  • Time
  • Show
Clear All
new posts

  • Clarifications on [series] param in setBarBgColor

    Hi,

    Can someone please clarify the meaning, scope and usage of the [series] parameter in setBarBgColor?

    In a complex return array [many plots], this parameter affects the view of the plots [sometimes disappears behind the Bg], the color of the font in CursorWindow [makes it the same with Bg=>can't see it anymore], etc in a way I could not define.

    Note: What I want to accomplish is to use it instead of PlotHistogram [can see it better, when plots are only 1-2 thick] or to color between plots, as needed. But I still need to see the plots [so must be on top of Bg] and I don't want to affect the font in CursorWindow.

    Thank you.
    Mihai Buta
    Last edited by mbuta; 05-19-2007, 11:29 AM.
    Mihai Buta

  • #2
    Hello Mihai,

    The optional series, or index, parameter of the setBarBgColor( color [, index] [, yMin] [, yMax] ) function designates which of the returned (or plotted) data series you wish to apply the background coloring for. For example, if you are returning 3 data series to be plotted by main(), the 0 series index refers to the first item in the return array, 1 refers to the second item and 2 refers to the third item, etc.


    return new Array(data1, data2, data3);

    where:

    data1 = series index of 0
    data2 = series index of 1
    data3 = series index of 2

    With multiple return arrays, the background color specified with the highest series index will appear in the foreground relative to any other setBarBgColor() calls made. Specifying the series index is not necessary with this function unless you are also using the yMin/yMax parameters to color certain sections of the background for multiple returned data series.

    This issue with the specified background color also coloring the font in the cursor window label has been fixed for the 8.1 version.

    The plotted series will be on top of the background color, you just need to use different colors for the foreground color and background color of the same data series.
    Jason K.
    Project Manager
    eSignal - an Interactive Data company

    EFS KnowledgeBase
    JavaScript for EFS Video Series
    EFS Beginner Tutorial Series
    EFS Glossary
    Custom EFS Development Policy

    New User Orientation

    Comment


    • #3
      Hi Jason,

      Thank you for clarifications. I will download 8.1 when is released.

      Note: I hope they also fixed the colors on Y axix as well [they also changed to blue, my default color in premain, since I use setBgColor, even when not active, maybe my mistake].

      Additional question: I installed eSignal on a new computer and the Formula Output Window does not automatically open when an error is detected [like it does on other computers].
      Is there a way to set it to open [I could not find it].

      Thank you.

      Mihai Buta
      Mihai Buta

      Comment


      • #4
        Hello Mihai,

        Originally posted by mbuta
        Hi Jason,

        Thank you for clarifications. I will download 8.1 when is released.
        You're most welcome.

        Note: I hope they also fixed the colors on Y axix as well [they also changed to blue, my default color in premain, since I use setBgColor, even when not active, maybe my mistake].
        The y-axis label will be the same color as your defaults in preMain() set by setDefaultBarFgColor(). If you subsequently call setBarFgColor() or setDefaultBarFgColor() in main(), this color will override the preMain() defaults. This is an intended behavior. If I have misunderstood you, please post a code example and a chart image along with a more detailed description of the issue you are experiencing.

        Additional question: I installed eSignal on a new computer and the Formula Output Window does not automatically open when an error is detected [like it does on other computers].
        Is there a way to set it to open [I could not find it].

        Thank you.

        Mihai Buta
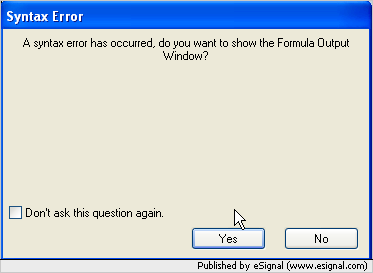
        If you have the FOW closed when an error occurs, you should see the following window appear.


        If you previously selected the check box for the " Don't ask again " option and then clicked on "NO," the FOW will not appear when syntax errors occur. To fix this, you can try re-installing or you can edit your WinSig.ini file. It is located in c:\windows\. Open this file and search for "FormulaOutputWindow" and make sure you have the three lines as follows.

        [FormulaOutputWindow]
        DontAsk=No
        Setting=Yes

        This will allow the initial "Syntax Error" window to appear again upon the first error. You can select the check box for the "Don't ask again" option, but be sure to select the "Yes" button if you do. Let me know if this resolves the problem.
        Jason K.
        Project Manager
        eSignal - an Interactive Data company

        EFS KnowledgeBase
        JavaScript for EFS Video Series
        EFS Beginner Tutorial Series
        EFS Glossary
        Custom EFS Development Policy

        New User Orientation

        Comment


        • #5
          Hi Jason,

          Re. FOW:
          I made the changes in WinSig and apparently is working now.

          Re. y-Axix Colors: The background should be the same color as the plot FgColor and it used to be like that, but now [since I use the setBGColor] that is not ntrue anymore. They all show on blue Bg, which is not even what I have in pre-main. Please note that I set specific default color to each plot when I initiate it [I have a dynamic plotting engine that allows me to add/remove plots easily, as needed].

          Thank you for your help and look forward for 8.1 version.

          Best Regards,
          Mihai Buta
          Mihai Buta

          Comment


          • #6
            Hello Mihai,

            Originally posted by mbuta
            Hi Jason,

            Re. FOW:
            I made the changes in WinSig and apparently is working now.
            Most excellent.

            Re. y-Axix Colors: The background should be the same color as the plot FgColor and it used to be like that, but now [since I use the setBGColor] that is not ntrue anymore. They all show on blue Bg, which is not even what I have in pre-main. Please note that I set specific default color to each plot when I initiate it [I have a dynamic plotting engine that allows me to add/remove plots easily, as needed].
            Please post a code example and a chart image and I'll take a look.

            Thank you for your help and look forward for 8.1 version.

            Best Regards,
            Mihai Buta
            You're most welcome.
            Jason K.
            Project Manager
            eSignal - an Interactive Data company

            EFS KnowledgeBase
            JavaScript for EFS Video Series
            EFS Beginner Tutorial Series
            EFS Glossary
            Custom EFS Development Policy

            New User Orientation

            Comment


            • #7
              Hi Jason,

              Srry for the late reply.

              Posting the efs is irrelevant here, because it has to do with chart settings.

              I uploaded a picture [see below], where you can see the problem. I run the same efs in all panes, including Price Pane.
              If "setBarBgColor" is not used in the ReturnArray engine [RegM0, BsMx, ADX panes], or plots are not [explicitly] recolored avery bar [CCI pane] the y-axix shows all blue.

              If plots are colored every bar [like, vD, MARSI], it is ok.

              In Price pane I run the previous revision, where there is no setBarBgcolor.

              NOTE: Late comment/observation. Apparently, all plots, in all panes show blue in y-axix. Those that are re-colored on each bar will show diferent colors. I am not sure there is any connexion to setBarBgColor.

              I hope it will help.

              Best Regards,
              Mihai Buta


              Last edited by mbuta; 05-25-2007, 06:55 AM.
              Mihai Buta

              Comment


              • #8
                Hi Jason,

                The bug is, obviously, in my efs and setBarBgColor may not be the problem. I copied the ReturnArray engine [that contains the setBarBgColor] over an older version of my efs and works fine.

                Maybe somobody can give a logical explaination of how an efs in fluences the color on y-axix [for which there is no setup option] and why would that color be diferent from the color of the plot.

                Thank you.
                Mihai Buta
                Mihai Buta

                Comment

                Working...
                X