 Tweet
Tweet
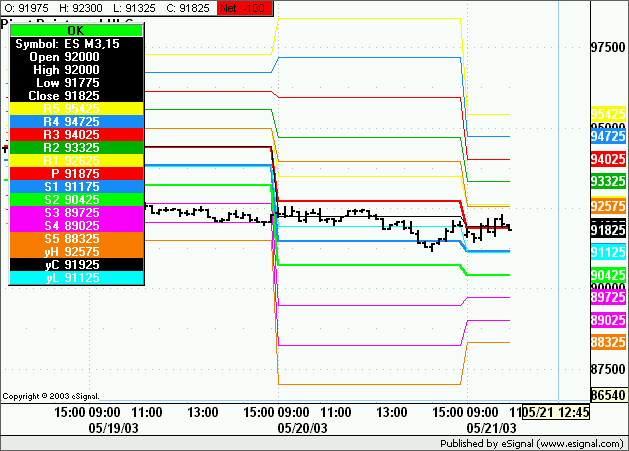
I was able to find the below .efs study and it works just great.
Could someone help me add R3 and S3.
Bruce
P.S. I don't know where I found this and don't know who originally created it but you have my apprecation
==========
function preMain() {
setPriceStudy(true);
setStudyTitle("Prior Day");
setCursorLabelName("R2", 0);
setCursorLabelName("R1", 1);
setCursorLabelName("PP", 2);
setCursorLabelName("S1", 3);
setCursorLabelName("S2", 4);
setCursorLabelName("H", 5);
setCursorLabelName("C", 6);
setCursorLabelName("L", 7);
//setComputeOnClose(true);
// R2
setDefaultBarStyle(PS_DASH, 0);
setDefaultBarFgColor(Color.red, 0);
setDefaultBarThickness(2, 0);
// R1
setDefaultBarStyle(PS_DASH, 1);
setDefaultBarFgColor(Color.red, 1);
setDefaultBarThickness(1, 1);
// Pivot Point
setDefaultBarStyle(PS_DASH, 2);
setDefaultBarFgColor(Color.blue, 2);
setDefaultBarThickness(1, 2);
// S1
setDefaultBarStyle(PS_DASH, 3);
setDefaultBarFgColor(Color.green, 3);
setDefaultBarThickness(1, 3);
// S2
setDefaultBarStyle(PS_DASH, 4);
setDefaultBarFgColor(Color.green, 4);
setDefaultBarThickness(2, 4);
// Previous Day's High
setDefaultBarStyle(PS_SOLID, 5);
setDefaultBarFgColor(Color.green, 5);
setDefaultBarThickness(1, 5);
// Previous Day's Close
setDefaultBarStyle(PS_SOLID, 6);
setDefaultBarFgColor(Color.grey, 6);
setDefaultBarThickness(1, 6);
// Previous Day's Low
setDefaultBarStyle(PS_SOLID, 7);
setDefaultBarFgColor(Color.red, 7);
setDefaultBarThickness(1, 7);
}
// globals
var vOutputArray = null;
var vLastSeenDay = null;
var vInterval = null;
var vSymbol = null;
function main() {
// initialize upon first loading formula
if(getBarState() == BARSTATE_ALLBARS) {
vInterval = getInterval();
vSymbol = getSymbol().toUpperCase();
// for RTH, eg, to convert, ES Z2 to ES Z2=2
var rootSymbol = vSymbol.substring(0,3);
if (rootSymbol == "ES " || rootSymbol == "NQ ")
if ( vSymbol.indexOf("=2") == -1 )
vSymbol += "=2";
vSymbol += ",D";
return null;
}
// return null if not an intraday chart
if(vInterval == null || vInterval == "D" ||
vInterval == "W" || vInterval == "M" || vInterval == "T")
return null;
// if first bar in new day, get and save yesterday's data
var vThisday = null;
if (vLastSeenDay != (vThisDay = getDay()) ) {
var vTime = getValue("Time");
if(vTime != null) {
var vYDay = getPreviousTradingDay(vTime,vSymbol);
if(vYDay != null) {
var vIndex = getFirstBarIndexOfDay(vYDay,vSymbol);
if(vIndex != null) {
var ydayH = getValueAbsolute("High", vIndex,
vSymbol);
var ydayL = getValueAbsolute("Low", vIndex,
vSymbol);
var ydayC = getValueAbsolute("Close", vIndex,
vSymbol);
var ydayP = (ydayH + ydayL + ydayC) / 3;
var ydayR1 = 2 * ydayP - ydayL;
var ydayS1 = 2 * ydayP - ydayH;
var ydayR2 = (ydayP - ydayS1) + ydayR1;
var ydayS2 = ydayP - (ydayR1 - ydayS1);
vOutputArray = new Array
(ydayR2,ydayR1,ydayP,ydayS1,ydayS2,
ydayH,ydayC,ydayL);
vLastSeenDay = vThisDay;
return vOutputArray;
}
}
return null;
}
}
// else just return the saved data
else
return vOutputArray;
}

Comment