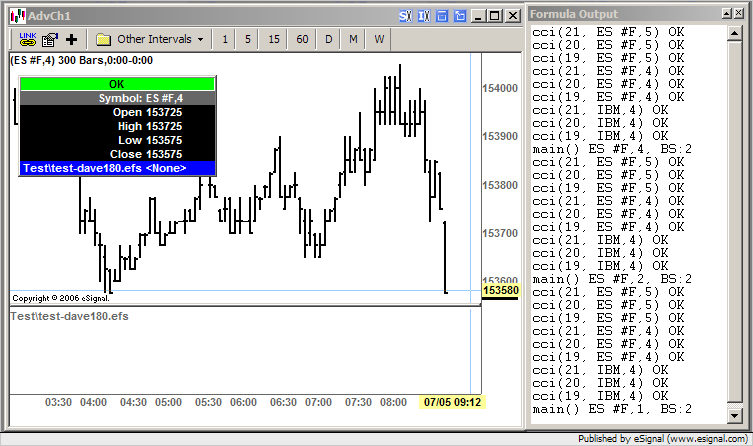
Announcement

Collapse
No announcement yet.

cci() fails for specific length, symbol and time period

Collapse
X
 
  • Filter
  • Time
  • Show
Clear All
new posts

  • cci() fails for specific length, symbol and time period

    I get this output:


    main() ES #F,1, BS:2
    cci(19, IBM,4) OK
    cci(20, IBM,4) OK
    cci(21, IBM,4) OK
    cci(19, ES #F,4) OK
    cci(20, ES #F,4) Failed
    cci(21, ES #F,4) OK
    cci(19, ES #F,5) OK
    cci(20, ES #F,5) OK
    cci(21, ES #F,5) OK

    note the single "failed" line, from:

    PHP Code:
    function main() {

        var 
    nBarState getBarState();
        if (
    nBarState == BARSTATE_ALLBARS) { 
            
    debugPrint("main() "+getSymbol()+","+getInterval()+", BS:"+nBarState+"\n");
            var 
    nS;
            var 
    nC 0;
            var 
    msers = new Array(1);
            var 
    mCCIs = new Array(1);
            var 
    sSI = ["IBM,4","ES #F,4","ES #F,5"];
            var 
    n;

            for(
    nS 0nS sSI.lengthnS++){  // loop through test symbol and time periods in sSI
                
    msers[nS] = sym(sSI[nS]);
                for (
    n=19;n<=21;n++) { // loop through a few CCI lengths
                    
    debugPrint("cci("+n+", "+sSI[nS]+") "
                    
    +( (mCCIs[nC++] = cci(n,msers[nS])) == null ?"Failed\n":"OK\n")); 
                }
            }
        }
        return;

    In other words, I can create cci(n,s) as long as (n != 20 && s != sym("ES #F,4")).
    What is special about cci(20, sym("ES #F,4")) ??????

    If I change the chart to "ES #F,2" the cci() no longer fails. If I change it back to "ES #F,1" it fails as before.

    Regards

    Dave

  • #2
    Dave180
    FWIW your sample script appears to be working fine at my end (see enclosed screenshot)
    Alex

    Comment


    • #3
      Thanks Alexis,

      Jason, looks like it's over to you please.

      Thanks

      Dave

      Comment


      • #4
        dave180,

        Seems to be working on my end as well. I attached a screenshot of what I am seeing. I suspect the issue is on your end. Hope the screenshot helps.

        Comment


        • #5
          one thing you might check..

          is the TIME TEMPLATE you are using..

          Notice that both Alex and Steve are using a custom time template for their tests (300 bars and 500 bars). It may be an issue where their setup is working and your's is not because of your time template..

          I have a client that loads over 100 charts every day for an automated trading system we created. He has a little "auto-loader" program we created for him to dump the symbols he wants into esignal (where it automatically loads each chart for him). The problem is we're passing a unique setting to a Bollinger Band for stops in his code. This means we might be running on a 2 minute chart and loading both a 3 min and 6 min BB level for our stop logic.

          The problem we experience is a "hang" of the efs (it says "loading data"). And it only happens to SOME CHARTS. I've tried everything to fix this and believe it is a delay from the esignal data servers in responding to all the requests being made (100+ upon start up).

          I'm not saying this will FIX your problem, but I'm just trying to relate similar issues I've had in the past.
          Brad Matheny
          eSignal Solution Provider since 2000

          Comment

          Working...
          X