Announcement

Collapse
No announcement yet.

compare 2 oscillators

Collapse
X
 
  • Filter
  • Time
  • Show
Clear All
new posts

  • compare 2 oscillators

    what i am trying to do is to get the lower indicator bg color change if price oscillator < price oscillator(-1). i understand there are various ways to do it. and below is the line i added to the copied customOsc.efs file. so far i have no clue why i couldn't get the bg color change. actually, how can i simply compare the two price oscillators


    setDefaultBarBgColor(Color.while,0);
    ....
    if (osc(Short,Long,eval(Type),close(),sym(vSymbol),in v(Interval)) < osc(Short,Long,eval(Type),close(-1),sym(vSymbol),inv(Interval))) setBarBgColor(Color.red,0);

    or

    if (osc(Short,Long,eval(Type),eval(Source)(sym(vSymbo l)),,,0) < osc(Short,Long,eval(Type),eval(Source)(sym(vSymbol )),,,-1)) setBarBgColor(Color.red,0);
  • #2
    Hello dietcoke2000,

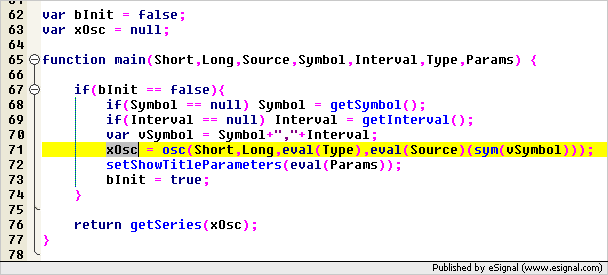
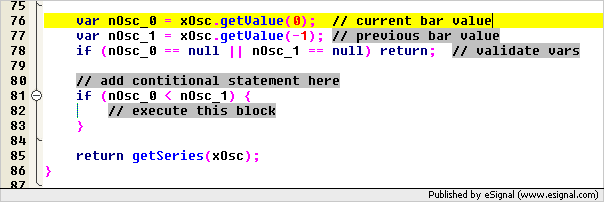
    Rather than making direct calls to the osc() study inside your conditional statements, I would suggest pulling out the required bar values for the series object in which the study was assigned to. This will help simplify things a bit. In the formula you are referencing the global variable, xOsc, is being assigned to the osc() study.


    Use the .getValue() method of the Sereis Object to assign it's current and previous bar values to some local variables that will be used in your conditional statement.


    Try implementing these changes and if you run into any problems, post your updated formula code.
    Jason K.
    Project Manager
    eSignal - an Interactive Data company

    EFS KnowledgeBase
    JavaScript for EFS Video Series
    EFS Beginner Tutorial Series
    EFS Glossary
    Custom EFS Development Policy

    New User Orientation

    Comment


    • #3
      thanks for the suggestion from your last post.

      i continue to finish this indicator i am constructing now. and i encounter a few other matters.

      i am currently using 'PLOTTYPE_HISTOGRAM' to display this indicator. and i want the indicator to always show the zero-line (when all calculations result in positive (or negative)). there are three issues here,

      1, if i add 0-line, there will be a 0-line cursor label appear in cursor window, which is something i really want to live without. and i just want the osc value in the cursor window. is there a way i could just disable the 0-line cursor label, but not the osc's?

      2, other than adding 0-line, is there another way which is quicker and easier? (like cpu friendly)

      3, 'little short, don't you think!' because this osc uses MAs to construct its final number, then i will use ma in the exmaple, it should be quick and simple. for example, if i have sma200 and a chart w/ 300bar, then i will only have a sma about 100bar long. other than dragging the chart to the right and back, is there another way to get the sma all the way thru to the left?

      look forward to your reply.

      Comment


      • #4
        Hello dietcoke2000,

        You're most welcome.

        1 & 2) You can use the addBand() function to draw the zero line instead of returning a 0 from the return statement.

        3) EFS study calculations base their results on the data that is loaded into the chart. Therefore, if you are using a 200 period MA, the first bar that will be able to calculate that result would be on the 200th bar from the oldest bar in the chart. There isn't any way around that. If you want to see more values plotted you can use a custom time template to force a longer history to load into your chart. Regardless of the amount of data present, the first 199 bars will not be able to calculate a 200 period MA.
        Jason K.
        Project Manager
        eSignal - an Interactive Data company

        EFS KnowledgeBase
        JavaScript for EFS Video Series
        EFS Beginner Tutorial Series
        EFS Glossary
        Custom EFS Development Policy

        New User Orientation

        Comment

        Working...
        X