Announcement

Collapse
No announcement yet.

Series plot trouble

Collapse
X
 
  • Filter
  • Time
  • Show
Clear All
new posts

  • Series plot trouble

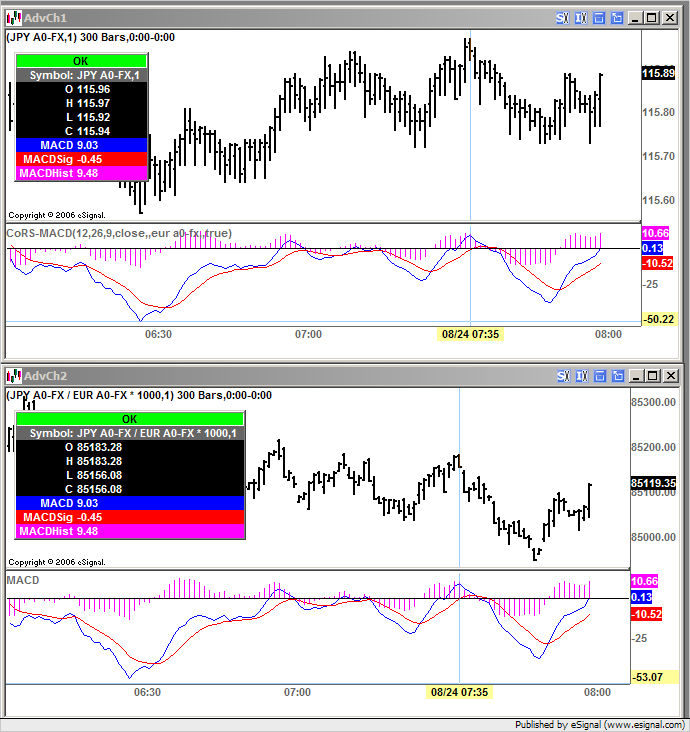
    Hi Alex. You helped me with the attached code some time ago. For some reason I cannot get the array to plot more than ~ 170 bars. It only plots up to the amount of data first loaded in the chart and then goes awry. Can you help?


    Thanks.
    David
    Attached Files

  • #2
    David
    From what I am seeing at my end the script appears to be working fine on both historical and real time data.
    The enclosed screenshot was taken after about half an hour of real time test and the values returned by the script are identical to those of the customMACD.efs running on a chart for the same spread.
    Alex

    Comment

    Working...
    X