Announcement

Collapse
No announcement yet.

Mixing intervals for calculations . . .

Collapse
X
 
  • Filter
  • Time
  • Show
Clear All
new posts

  • Mixing intervals for calculations . . .

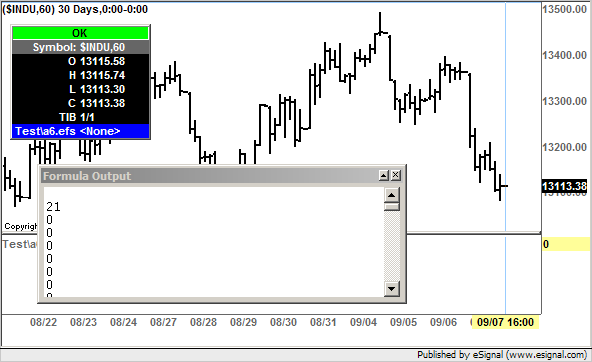
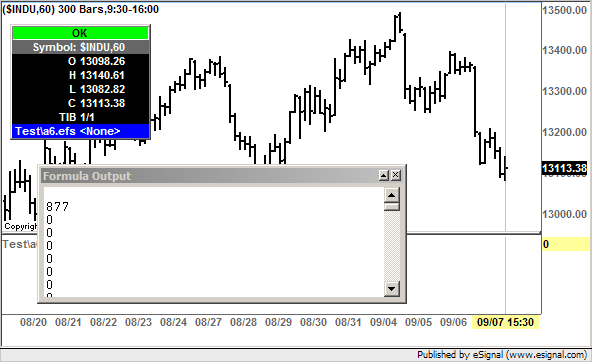
    Regardless of the interval selected for a chart, I would like to load the array below with all of the ticks in the last bar. I was using xInterval=1 and getValue("close",0,getInterval(),xSymbol) to rely on 1-minute data, but want to switch to tick data. How do I determine how many ticks in a bar so that I can replace the -2 (for testing only) with the number of ticks? Thanks.

    ------------------------------
    function main () {
    if (getBarState == BARSTATE_ALLBARS) return;
    var xInterval = "T";
    var xSymbol = getSymbol()+","+xInterval;
    pArray = getValue ("close", 0, -2, xSymbol);
    return new Array (pArray[0], pArray[1]);
    }

  • #2
    AssetHound
    Assuming I understood correctly what you are trying to accomplish then on each bar you need to drill down to the 1T interval using the inv() function and loop through the 1T data that is included within that bar's time frame.
    Here is a very basic example of one way to do it.
    PHP Code:
    if(getCurrentBarIndex()==0){
            var 
    CurrentBarTime = (hour(0)*100) + minute(0);
            
    Counter 0;//this variable needs to be declared globally
            
    var 0;
            while((
    hour(-i,inv("1t"))*100)+minute(-i,inv("1t"))>=CurrentBarTime){
                
    Counter++;
                
    i++;
            }
        } 
    In the example I first check that we are on the most current bar (so as to avoid running the section of code on every bar as the script loads) and I retrieve the time in hours and minutes for that bar.
    Then I use a while loop to cycle back through the data of the 1T interval and count all the ticks that have a time stamp equal or greater to that of the current bar (which is based on the chart interval).
    In the screenshots enclosed below you can see the logic applied to two 60 minute charts one based on 24 hour Time Template and the other based on a 9:30-16:00 Time Template. As you can see the logic returns the number of ticks within the last bar of each chart.
    As I mentioned earlier this is a basic example just to illustrate the logic.
    Alex


    Comment


    • #3
      This was very helpful. Thanks very much.

      Comment


      • #4
        AssetHound
        My pleasure and I am glad to know that it was helpful
        Alex

        Comment


        • #5
          Alexis,

          Don't I need to start at i=0 to count the last tick?

          Comment


          • #6
            AssetHound
            Yes it should be i=0 to include the current tick. I forgot to reset it to 0 after debugging the code where I was using i=1 to get the index of the bar where the count was starting on the 1t interval.
            I have corrected the orignal code example to avoid any confusion
            Alex.

            Comment


            • #7
              Thanks very much for verifying. This is still a learning exercise for me and your prompt response is much appreciated!

              Comment


              • #8
                AssetHound
                You are most welcome
                Alex

                Comment

                Working...
                X