Announcement

Collapse
No announcement yet.

Oddity in drawLineRelative?

Collapse
X
 
  • Filter
  • Time
  • Show
Clear All
new posts

  • Oddity in drawLineRelative?

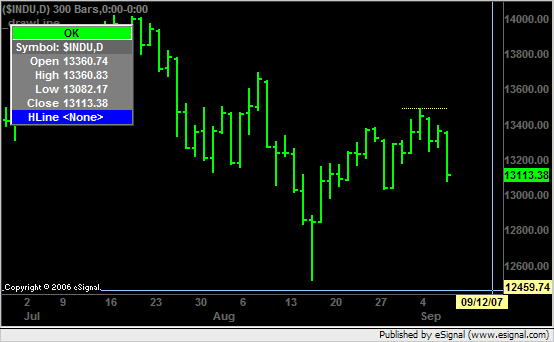
    I'd like to be able to add discretionary support and resistance lines to my charts in the form of dotted lines that just extend the needed distance on the chart, rather than all across all loaded bars, as with the built-in Horizontal Line option under "Line Tools."

    However, the drawLineRelative function seems to always ignore the actual value input for the x1 field.

    Would appreciate understanding what's going on.

    Thanks,

    Steve

  • #2
    Here's a chart of _drawLine.efs in operation

    Here's the script as it operates -- even though I've input a starting point that's only five bars back.
    Attached Files
    Last edited by Steven Miller; 09-09-2007, 01:46 PM.

    Comment


    • #3
      Steve
      You may want to post the code so that someone can assist you with it
      Alex

      Comment


      • #4
        Sorry, thought I had attached the script to the first post.

        Here it is:

        debugClear();

        function preMain() {
        setPriceStudy(true);
        setStudyTitle("_drawLine");
        setCursorLabelName("HLine", 0);
        setShowTitleParameters( false );
        }


        askForInput();

        var iPrice = new FunctionParameter("iPrice", FunctionParameter.NUMBER);
        iPrice.setDefault( 1 );

        var iColor = new FunctionParameter("iColor", FunctionParameter.COLOR);
        iColor.setDefault( Color.paleyellow);

        var iStart = new FunctionParameter("iStart", FunctionParameter.NUMBER);
        iStart.setDefault( 1 );

        var iEnd = new FunctionParameter("iEnd", FunctionParameter.NUMBER);
        iEnd.setDefault( 1);

        function main( iPrice , iColor,iStart,iEnd) {

        var dline = 0;

        if(iPrice==null) return;

        drawLineRelative( iStart, iPrice,iEnd, iPrice, PS_DOT, 1, iColor,dline+rawtime(0))

        return ;

        }

        Comment


        • #5
          Steve
          That is not an oddity but the result of the tagID parameter that you are using in the drawLineRelative() command.
          Because you set that parameter to use a different tagID each time the command is executed the formula will maintain all the lines drawn as it runs through the historical bars while the script is loading.
          In order to display only the last drawn line you need to change that parameter from
          drawLineRelative(...,...,dline+rawtime(0));
          to
          drawLineRelative(...,...,dline);
          Because the tagID is now common to all the lines being drawn only the last one will be displayed on the chart.
          In the enclosed screenshot you can see your script modified as indicated above and set to draw the line for 5 bars only
          Alex

          Comment


          • #6
            Hi, Alex --

            I wanted to be able to mark both the highs and lows of a trading range. That's why I was trying to use tags made unique by the rawtime() function.

            Is there a way to do this without inputting unique tags each time?

            Thanks,

            Steve

            Comment


            • #7
              Steve
              You need to use a drawLineRelative() command for each line you want to draw and assign a tagID that is unique to each command eg "dlineHigh" for one, "dlineLow" for the other, etc
              Alex

              Comment

              Working...
              X