Here are two simple scripts that I have found to be quite useful.
The first one writes the OHLC values of the current bar at the bottom of the chart and is actually a revision of one I posted some time ago.
That version though had some limitations as the values of OHLC were written on the chart in four distinct groups making it difficult to space them correctly for use with a variety of symbols.
I have modified the efs and now write all the values into a single group so that the OHLC values will always have the same spacing relative to each other irrespective of the number of integers or decimals.
I have now included a "Decimals" setting so that the efs can be easily adapted to the symbols used. This is set to show 2 decimals by default but can be changed through Edit Studies (the default can be changed by using Editor and modifying the value in Line 30).
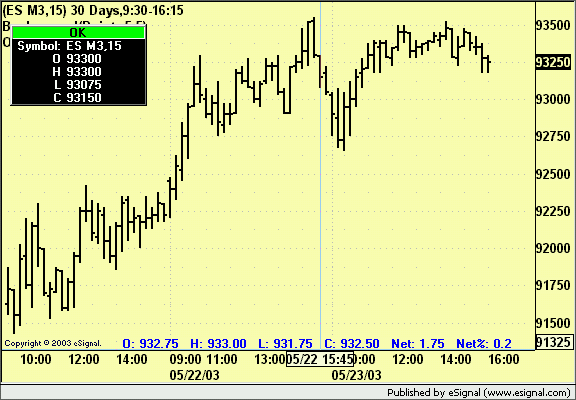
I have also added two new fields ie Net and Net% which are calculated in the following way. If the chart is intraday or daily then the Net and Net% are based on the prior daily close, if the chart is weekly or higher then the Net and Net% are based on the corresponding prior period. This is particularly useful on higher intervals as there is no immediate way to see these values otherwise.
The text will be colored in blue if the current close is higher than the previous daily close (if using intraday or daily charts) or the one of the prior period (if using weekly or higher) and will be colored red if lower (gray if unchanged).
Lastly there is a setting in Edit Studies that will allow to shift the text position sideways. The default value is 25 and decreasing the number will shift the text to the left while increasing it will shift it to the right.
Any of the 7.3 beta versions (or higher) are required to run this efs. Also required is getPrevOHLC.efs in the OHLC subfolder of the Formulas folder.
Alex
Note: A more recent version of this efs is available here.
The first one writes the OHLC values of the current bar at the bottom of the chart and is actually a revision of one I posted some time ago.
That version though had some limitations as the values of OHLC were written on the chart in four distinct groups making it difficult to space them correctly for use with a variety of symbols.
I have modified the efs and now write all the values into a single group so that the OHLC values will always have the same spacing relative to each other irrespective of the number of integers or decimals.
I have now included a "Decimals" setting so that the efs can be easily adapted to the symbols used. This is set to show 2 decimals by default but can be changed through Edit Studies (the default can be changed by using Editor and modifying the value in Line 30).

I have also added two new fields ie Net and Net% which are calculated in the following way. If the chart is intraday or daily then the Net and Net% are based on the prior daily close, if the chart is weekly or higher then the Net and Net% are based on the corresponding prior period. This is particularly useful on higher intervals as there is no immediate way to see these values otherwise.
The text will be colored in blue if the current close is higher than the previous daily close (if using intraday or daily charts) or the one of the prior period (if using weekly or higher) and will be colored red if lower (gray if unchanged).
Lastly there is a setting in Edit Studies that will allow to shift the text position sideways. The default value is 25 and decreasing the number will shift the text to the left while increasing it will shift it to the right.
Any of the 7.3 beta versions (or higher) are required to run this efs. Also required is getPrevOHLC.efs in the OHLC subfolder of the Formulas folder.
Alex
Note: A more recent version of this efs is available here.


Comment