 Tweet
Tweet
1] I unsuccessfully tried to insert an image for this question into this thread. Please tell me how to do that.
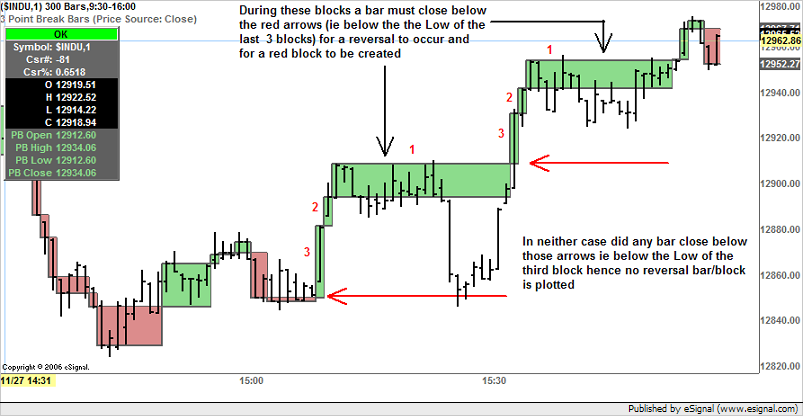
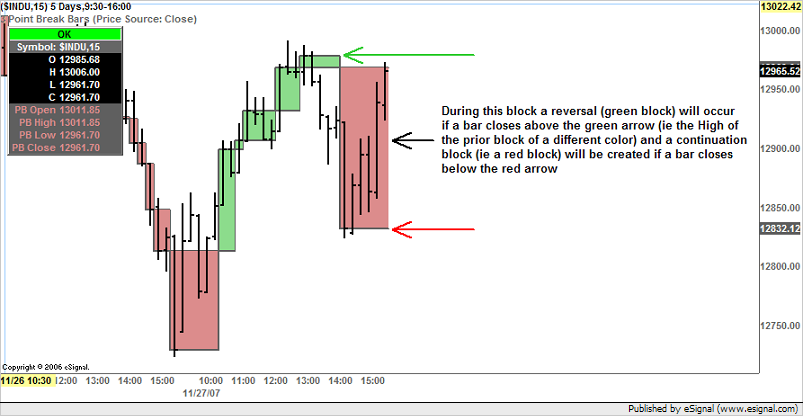
2] Below is code for a study which I applied to a daily chart. It displays horizontal green and red colored horizontal rectangles to show "Up" or "Down" mode. However the switch from one color to the other sometimes does not ocur at the correct time [eg] when the close is below the low of the previous 3 days the color does not change from green to red? [Sometimes colors switch correctly and sometimes not.]
/************************************************** ***************
Provided By : eSignal (c) Copyright 2004
Description: Point Break Bars for Bar Chart
Version: 1.0
Notes:
This study displays PB bars on regular bar or candlestick chart.
Formula Parameters: Defaults:
Point Break Amount 3
Price Source Close
Up Color Light Green
Dn Color Light Red
Outline Color Grey
************************************************** ***************/
function preMain() {
setPriceStudy(true);
setStudyTitle("Point Break Bars");
setCursorLabelName("PB Open", 0);
setCursorLabelName("PB High", 1);
setCursorLabelName("PB Low", 2);
setCursorLabelName("PB Close", 3);
setPlotType(PLOTTYPE_SQUAREWAVE, 0);
setPlotType(PLOTTYPE_SQUAREWAVE, 1);
setPlotType(PLOTTYPE_SQUAREWAVE, 2);
setPlotType(PLOTTYPE_SQUAREWAVE, 3);
setDefaultBarThickness(2, 0);
setDefaultBarThickness(2, 1);
setDefaultBarThickness(2, 2);
setDefaultBarThickness(2, 3);
setDefaultBarFgColor(Color.RGB(95,95,95), 0);
setDefaultBarFgColor(Color.RGB(95,95,95), 1);
setDefaultBarFgColor(Color.RGB(95,95,95), 2);
setDefaultBarFgColor(Color.RGB(95,95,95), 3);
setShowTitleParameters(false);
var fp1 = new FunctionParameter("nPB", FunctionParameter.NUMBER);
fp1.setName("Point Break Amount");
fp1.setLowerLimit(2);
fp1.setDefault(3);
var fp2 = new FunctionParameter("sSource", FunctionParameter.STRING);
fp2.setName("Price Source");
fp2.addOption("Open");
fp2.addOption("High");
fp2.addOption("Low");
fp2.addOption("Close");
fp2.addOption("HL/2");
fp2.addOption("HLC/3");
fp2.addOption("OHLC/4");
fp2.setDefault("Close");
var fp3 = new FunctionParameter("cUp", FunctionParameter.COLOR);
fp3.setName("Up Color");
fp3.setDefault(Color.RGB(140, 220, 140));
var fp4 = new FunctionParameter("cDn", FunctionParameter.COLOR);
fp4.setName("Down Color");
fp4.setDefault(Color.RGB(220, 140, 140));
var fp5 = new FunctionParameter("cOutline", FunctionParameter.COLOR);
fp5.setName("Outline Color");
fp5.setDefault(Color.RGB(95,95,95));
}
var aPBopen = null;
var aPBhigh = null;
var aPBlow = null;
var aPBclose = null;
var bInit = false;
var vPBtrend = "Up"; // Up or Dn - Developing PB bar
var vPBtrend1 = "Up"; // Up or Dn - Confirmed PB bar
var bNew = false; // New PB bar
var Price = null;
var Price1 = null;
function main(nPB, sSource, cUp, cDn, cOutline) {
var nState = getBarState();
if (nState == BARSTATE_NEWBAR) {
Price1 = Price;
vPBtrend1 = vPBtrend;
if (bNew == true) {
// New PB bar confirmed, update PB arrays
var vH = aPBhigh[0];
var vL = aPBlow[0];
if (vPBtrend == "Up") {
aPBopen.pop();
aPBopen.unshift(vH);
aPBhigh.pop();
aPBhigh.unshift(Price);
aPBlow.pop();
aPBlow.unshift(vH);
aPBclose.pop();
aPBclose.unshift(Price);
} else if (vPBtrend == "Dn") {
aPBopen.pop();
aPBopen.unshift(vL);
aPBhigh.pop();
aPBhigh.unshift(vL);
aPBlow.pop();
aPBlow.unshift(Price);
aPBclose.pop();
aPBclose.unshift(Price);
}
}
}
Price = null;
switch (sSource) {
case "Open" :
Price = open(0);
break;
case "High" :
Price = high(0);
break;
case "Low" :
Price = low(0);
break;
case "Close" :
Price = close(0);
break;
case "HL/2" :
Price = (high(0) + low(0) )/ 2;
break;
case "HLC/3" :
Price = (high(0) + low(0) + close(0) )/ 3;
break;
case "OHLC/4" :
Price = (open(0) + high(0) + low(0) + close(0) )/ 4;
break;
}
if (bInit == false) {
setStudyTitle(nPB + " Point Break Bars (Price Source: " + sSource + ")");
setDefaultBarFgColor(cOutline, 0);
setDefaultBarFgColor(cOutline, 1);
setDefaultBarFgColor(cOutline, 2);
setDefaultBarFgColor(cOutline, 3);
aPBopen = new Array(nPB);
aPBhigh = new Array(nPB);
aPBlow = new Array(nPB);
aPBclose = new Array(nPB);
for (var i = 0; i < nPB; i++) {
aPBopen[i] = Price;
aPBhigh[i] = Price;
aPBlow[i] = Price;
aPBclose[i] = Price;
}
bInit = true;
}
// Test for new PB bar
if (Price1 == null) return;
bNew = false;
vPBtrend = vPBtrend1;
var nPBmax = aPBhigh[0];
var nPBmin = aPBlow[0];
for (var i = 0; i < nPB; i++) {
nPBmax = Math.max(nPBmax, aPBhigh[i]);
nPBmin = Math.min(nPBmin, aPBlow[i]);
}
if (vPBtrend == "Up") {
if (Price > nPBmax) {
bNew = true;
} else if (Price < nPBmin) {
bNew = true;
vPBtrend = "Dn";
}
} else if (vPBtrend == "Dn") {
if (Price > nPBmax) {
bNew = true;
vPBtrend = "Up";
} else if (Price < nPBmin) {
bNew = true;
}
}
// Current or developing PB bar
var nPBo = aPBopen[0];
var nPBh = aPBhigh[0];
var nPBl = aPBlow[0];
var nPBc = aPBclose[0];
if (bNew == true) { // New unconfirmed PB bar
var vH = aPBhigh[0];
var vL = aPBlow[0];
if (vPBtrend == "Up") {
nPBo = vH;
nPBh = Price;
nPBl = vH;
nPBc = Price;
} else if (vPBtrend == "Dn") {
nPBo = vL;
nPBh = vL;
nPBl = Price;
nPBc = Price;
}
}
// PB Bar Coloring
var PBColor = cDn;
if (vPBtrend == "Up") PBColor = cUp;
for (var i = 0; i < 4; i++) {
setBarBgColor(PBColor, i, nPBl, nPBh);
}
return new Array(nPBo, nPBh, nPBl, nPBc);
}
Comment