Announcement

Collapse
No announcement yet.

Keltner Indicator..

Collapse
X
 
  • Filter
  • Time
  • Show
Clear All
new posts

  • Keltner Indicator..

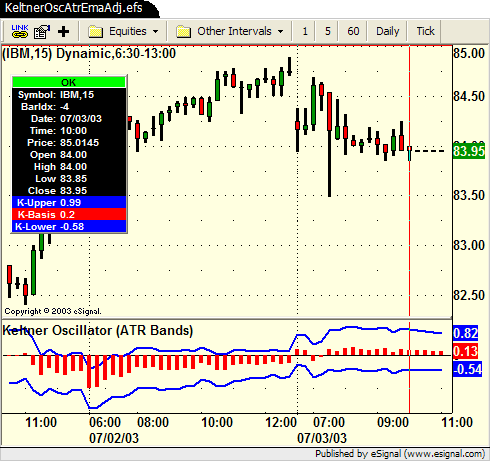
    Can someone create a keltner oscilator that can be ploted under the chart.. (not on price itself).

    Basically a Keltner study with 20 period EMA of basis line and 2.5 ATR bands... Whenever the close> than the upper band the oscilator would be greater than X.. and vice versa for a close underneath the lower band.


    --MIKE

  • #2
    Hello Mike,

    Thank you for your formula suggestion. Try this formula out and let me know if it's not what you expected. You'll notice I added the bands here as well, but plotted them as lines vs. histogram.

    The defaults are 20 periods for the EMA basis line and the bands are at 2.5 * ATR. You can adjust the period length (nInputLength) and the range factor (nRangeFactor) for the bands through the "Edit Studies" option.

    KeltnerOscAtrEmaAdj.efs

    Jason K.
    Project Manager
    eSignal - an Interactive Data company

    EFS KnowledgeBase
    JavaScript for EFS Video Series
    EFS Beginner Tutorial Series
    EFS Glossary
    Custom EFS Development Policy

    New User Orientation

    Comment

    Working...
    X