Announcement

Collapse
No announcement yet.

EFS does not update with each new Tick/bar

Collapse
This topic is closed.
X
X
 
  • Filter
  • Time
  • Show
Clear All
new posts

  • EFS does not update with each new Tick/bar

    Hi,

    If anyone knows how to get the following script to update continuously I would appreciated it very much.

    Currently after it loads it no longer plots.
    apparently the "vSig2/vSig1" in the:

    var vSig3 = macd(3, 10, 5, vSig2/vSig1);
    var vSig4 = macd(3, 10, 5, vSig2/vSig1);

    requires a valid "Source" so it does not update.
    Is there a way to have the "vSig2/vSig1" become an updatable source?

    Thanks in advance.

    RelRel3.efs/************************************************** **************************************************
    Copyright © eSignal, a division of Interactive Data Corporation. 2003. All rights reserved.
    This sample eSignal Formula Script (EFS) may be modified and saved under a new
    filename; however, eSignal is no longer responsible for the functionality once modified.
    eSignal reserves the right to modify and overwrite this EFS file with each new release.
    ************************************************** ************************************************** */

    var vLoaded = false;
    var vEdit = false;
    var cSym = "";
    var iSym = "$SPX";
    var vSig1 = 0;
    var vSig2 = 0;

    function preMain() {
    setPriceStudy(false);
    setCursorLabelName("RelRel3");

    setStudyTitle("RelRel3-10");
    if (vLoaded == false) {
    setDefaultBarFgColor(Color.RGB(255,180,0));
    setStudyTitle("RelRel3:" + cSym + " & " + iSym );
    } else {
    if (vEdit == false) {
    setStudyTitle("RelRel3:" + cSym + " & " + iSym);
    setCursorLabelName(cSym + "\/" + iSym);
    } else {
    setStudyTitle("RelREl3:" + cSym + " & " + iSym);
    setCursorLabelName(cSym + "\/" + iSym);
    }
    }
    setDefaultBarFgColor(Color.magenta,0);
    setDefaultBarThickness(2, 0);
    setDefaultBarFgColor(Color.cyan,1);
    setDefaultBarThickness(1, 1);
    setDefaultBarStyle(PS_DOT, 1);

    addBand(0, PS_DASHDOTDOT, 1, Color.yellow, "Tag1");

    }

    function main() {

    if (vLoaded == false) {
    cSym = getSymbol();
    vLoaded = true;
    preMain();
    }

    var vSym = getSymbol();

    vSig1 = efsInternal("do_spxRSI",iSym); // this generates the RSI of the SPX
    vSig2 = efsInternal("do_securRSI",vSym); // this generates the RSI of the security

    var vSig3 = macd(3, 10, 5, vSig2/vSig1); // calcs ratio of the security's RSI to that of the SPX,
    // then returns a classic 12-26 macd of it
    var vSig4 = macdSignal(3, 10, 5, vSig2/vSig1); // ditto, with the signal line

    if((vSig1 != 0) && (vSig2 != 0))
    return new Array (vSig3,vSig4);
    else
    return;
    }

    function do_spxRSI(Symbol1)
    {
    if(Symbol1 == "")
    return;
    var r = 14;

    var vValue = rsi(r);
    return vValue;

    }
    function do_securRSI(Symbol2)
    {
    if(Symbol2 == "")
    return;
    var r = 14;

    var vValue = rsi(r);
    return vValue;

    }
    Attached Files
    Last edited by waynecd; 02-25-2008, 07:13 AM.

  • #2
    Hi,

    I've tried ref(), creating a series, and arrays but I'm afraid that my very limited knowledge isn't enough. I think one of these should work but I'm probably doing it wrong.

    If anyone can point me in the right direction I would greatly appreciate it.

    Thanks in advance.

    Comment


    • #3
      Re: EFS does not update with each new Tick/bar

      waynecd

      requires a valid "Source" so it does not update.
      Is there a way to have the "vSig2/vSig1" become an updatable source?
      When you apply some math to a series [in your case as you divide a series by another in the equation vSig2/vSig1] the result is a value and not a series which is required if you want to use that as the source for the macd() function..
      To resolve this you need to calculate your equation either in a separate function within the same efs or in an external efs and call them using efsInternal() or efsExternal() which will create the required series that you can use as the source of the macd() function.
      For the description and syntax of these functions see the links to the corresponding articles in the EFS KnowledgeBase.
      You can also find further information on these two functions (complete with detailed examples) in this thread.
      For a practical example on how to create a separate function to create a ratio between two series see the example Chris Kryza posted in this thread.
      In your case the simplest solution is to use the dsDivSeries() function available in the dsFunctions.efsLib function library. You can find the latest revision of the dsFunctions.efsLib and its documentation here

      ...but I'm afraid that my very limited knowledge isn't enough.
      With regards to the limited knowledge in programming efs if you are interested in learning you may want to start by reviewing the JavaScript for EFS video series and the Core JavaScript Reference Guide. Those will provide you with a thorough introduction to programming in JavaScript which is at the foundation of EFS. Then go through the EFS KnowledgeBase and study the Help Guides and Tutorials which will provide you with the specifics of EFS.
      Alex


      Originally posted by waynecd
      Hi,

      If anyone knows how to get the following script to update continuously I would appreciated it very much.

      Currently after it loads it no longer plots.
      apparently the "vSig2/vSig1" in the:

      var vSig3 = macd(3, 10, 5, vSig2/vSig1);
      var vSig4 = macd(3, 10, 5, vSig2/vSig1);

      requires a valid "Source" so it does not update.
      Is there a way to have the "vSig2/vSig1" become an updatable source?

      Thanks in advance.

      RelRel3.efs/************************************************** **************************************************
      Copyright © eSignal, a division of Interactive Data Corporation. 2003. All rights reserved.
      This sample eSignal Formula Script (EFS) may be modified and saved under a new
      filename; however, eSignal is no longer responsible for the functionality once modified.
      eSignal reserves the right to modify and overwrite this EFS file with each new release.
      ************************************************** ************************************************** */

      var vLoaded = false;
      var vEdit = false;
      var cSym = "";
      var iSym = "$SPX";
      var vSig1 = 0;
      var vSig2 = 0;

      function preMain() {
      setPriceStudy(false);
      setCursorLabelName("RelRel3");

      setStudyTitle("RelRel3-10");
      if (vLoaded == false) {
      setDefaultBarFgColor(Color.RGB(255,180,0));
      setStudyTitle("RelRel3:" + cSym + " & " + iSym );
      } else {
      if (vEdit == false) {
      setStudyTitle("RelRel3:" + cSym + " & " + iSym);
      setCursorLabelName(cSym + "\/" + iSym);
      } else {
      setStudyTitle("RelREl3:" + cSym + " & " + iSym);
      setCursorLabelName(cSym + "\/" + iSym);
      }
      }
      setDefaultBarFgColor(Color.magenta,0);
      setDefaultBarThickness(2, 0);
      setDefaultBarFgColor(Color.cyan,1);
      setDefaultBarThickness(1, 1);
      setDefaultBarStyle(PS_DOT, 1);

      addBand(0, PS_DASHDOTDOT, 1, Color.yellow, "Tag1");

      }

      function main() {

      if (vLoaded == false) {
      cSym = getSymbol();
      vLoaded = true;
      preMain();
      }

      var vSym = getSymbol();

      vSig1 = efsInternal("do_spxRSI",iSym); // this generates the RSI of the SPX
      vSig2 = efsInternal("do_securRSI",vSym); // this generates the RSI of the security

      var vSig3 = macd(3, 10, 5, vSig2/vSig1); // calcs ratio of the security's RSI to that of the SPX,
      // then returns a classic 12-26 macd of it
      var vSig4 = macdSignal(3, 10, 5, vSig2/vSig1); // ditto, with the signal line

      if((vSig1 != 0) && (vSig2 != 0))
      return new Array (vSig3,vSig4);
      else
      return;
      }

      function do_spxRSI(Symbol1)
      {
      if(Symbol1 == "")
      return;
      var r = 14;

      var vValue = rsi(r);
      return vValue;

      }
      function do_securRSI(Symbol2)
      {
      if(Symbol2 == "")
      return;
      var r = 14;

      var vValue = rsi(r);
      return vValue;

      }
      Originally posted by waynecd
      Hi,

      I've tried ref(), creating a series, and arrays but I'm afraid that my very limited knowledge isn't enough. I think one of these should work but I'm probably doing it wrong.

      If anyone can point me in the right direction I would greatly appreciate it.

      Thanks in advance.

      Comment


      • #4
        Alex,

        Thank you very much.
        The guidance and links are very helpful

        Comment


        • #5
          waynecd
          My pleasure
          Alex


          Originally posted by waynecd
          Alex,

          Thank you very much.
          The guidance and links are very helpful

          Comment


          • #6
            Alex,

            It's done. Your help was invaluable. Attached is a chart image (displays the offset). I can only attach one file so the code for the two verisions follows:

            Just two issues;
            ---my version is offset forward by one bar when compared to the original version (as shown by the chart image when the lines cross).
            ---My version doesn't seem to load on tick charts such as the 55T. It just stays "Loading Data...' Any ideas?

            Is there a way to have it match the original version and to have it load on Tick charts?

            I will study the material in the links you sent me.

            Thanks again

            1. the original (historical only) version:

            /************************************/
            var vLoaded = false;
            var vEdit = false;
            var cSym = "";
            var iSym = "$SPX";
            var vSig1 = 0;
            var vSig2 = 0;

            function preMain() {
            setPriceStudy(false);

            setStudyTitle("RelRel3-10");
            if (vLoaded == false) {
            setDefaultBarFgColor(Color.RGB(255,180,0));
            setStudyTitle("RelRel3:" + cSym + " & " + iSym );
            } else {
            if (vEdit == false) {
            setStudyTitle("RelRel3:" + cSym + " & " + iSym);
            setCursorLabelName(cSym + "\/" + iSym);
            } else {
            setStudyTitle("RelREl3:" + cSym + " & " + iSym);
            setCursorLabelName(cSym + "\/" + iSym);
            }
            }
            setDefaultBarFgColor(Color.red,0);
            setDefaultBarThickness(2, 0);
            setDefaultBarFgColor(Color.blue,1);
            setDefaultBarThickness(1, 1);
            setDefaultBarStyle(PS_SOLID, 1);

            addBand(0, PS_DASHDOTDOT, 1, Color.black, "Tag1");

            }

            function main() {

            if (vLoaded == false) {
            cSym = getSymbol();
            vLoaded = true;
            preMain();
            }

            var vSym = getSymbol();

            vSig1 = efsInternal("do_spxRSI",iSym); // this generates the RSI of the SPX
            vSig2 = efsInternal("do_securRSI",vSym); // this generates the RSI of the security

            var vSig3 = macd(3, 10, 5, vSig2/vSig1); // calcs ratio of the security's RSI to that of the SPX,
            // then returns a classic 12-26 macd of it
            var vSig4 = macdSignal(3, 10, 5, vSig2/vSig1); // ditto, with the signal line

            if((vSig1 != 0) && (vSig2 != 0))
            return new Array (vSig3,vSig4);
            else
            return;
            }

            function do_spxRSI(Symbol1)
            {
            if(Symbol1 == "")
            return;
            var r = 14;

            var vValue = rsi(r);
            return vValue;

            }
            function do_securRSI(Symbol2)
            {
            if(Symbol2 == "")
            return;
            var r = 14;

            var vValue = rsi(r);
            return vValue;

            }

            //////////////////////////////////////////////////////////////////////////////
            2. my version (updates continuosly):

            /************************************/
            var cRSIStudy = null;
            var iRSIStudy2 = null;
            var nMACDStudy = null;
            var nMACDSIGStudy2 = null;
            var aFPArray = new Array();
            var bInitialized = false;
            var vEdit = false;
            var cSym = "";
            var xSym = "";


            //== PreMain function required by eSignal to set things up
            function preMain() {
            var x;
            setPriceStudy(false);

            setStudyTitle("RelRel3-xx10");//xx10 is just a version ID
            if (bInitialized == false) {
            setDefaultBarFgColor(Color.RGB(255,180,0));
            setStudyTitle("RelRel3: xx10");
            } else {
            if (vEdit == false) {
            setStudyTitle("RelRel3:" + cSym + " & " + xSym + "xx10");
            setCursorLabelName(cSym + "\/" + xSym);
            } else {
            setStudyTitle("RelREl3:" + cSym + " & " + xSym + "xx10");
            setCursorLabelName(cSym + "\/" + xSym);
            }
            }
            setDefaultBarFgColor(Color.red,0);
            setDefaultBarThickness(2, 0);
            setDefaultBarFgColor(Color.blue,1);
            setDefaultBarThickness(1, 1);
            setDefaultBarStyle(PS_SOLID, 1);

            addBand(0, PS_DASHDOTDOT, 1, Color.black, "Tag1");

            setShowTitleParameters( false );

            x=0;
            aFPArray[x] = new FunctionParameter( "vRSIPeriod", FunctionParameter.NUMBER);
            with( aFPArray[x] ) {
            setName( "RSI Period" );
            setLowerLimit( 1 );
            setUpperLimit( 99999 );
            setDefault( 14 );
            }
            x++;
            aFPArray[x] = new FunctionParameter( "iSym", FunctionParameter.STRING);
            with( aFPArray[x] ) {
            setName( "Comparison Symbol" );
            setDefault( "$SPX" );
            }
            }

            function main( vRSIPeriod, iSym ) {
            var x;
            var nBarIndex;
            var vSig1;
            var vSig2;
            var vSig3;
            var xSym = iSym
            var vSym = getSymbol();

            if ( getBarState() == BARSTATE_ALLBARS ) {
            return null;
            }

            if ( bInitialized == false ) {
            cSym = getSymbol();
            cRSIStudy = rsi(vRSIPeriod,sym(vSym));
            iRSIStudy2 = rsi(vRSIPeriod,sym(iSym));
            vSig1 = efsInternal("_div",cRSIStudy,iRSIStudy2);
            bInitialized = true;
            preMain();
            }

            nMACDStudy = macd(3, 10, 5, vSig1); // calcs ratio of the security's RSI to that of the SPX,
            nMACDSIGStudy2 = macdSignal(3, 10, 5, vSig3); // then returns a classic 12-26 macd of it
            vSig2 = nMACDStudy.getValue(0);
            vSig3 = nMACDSIGStudy2.getValue(0);

            return new Array( vSig2, vSig3);

            }

            function _div( _src1,_src2 ) {
            var x, y;

            x = _src1.getValue(0);
            y = _src2.getValue(0);


            if ( x==null || y==null ) return( null );
            return( x/y );
            }
            Attached Files
            Last edited by waynecd; 02-26-2008, 11:02 PM.

            Comment


            • #7
              Alex,

              I still haven't figured out how to get rid of the offset between the two studies but it does load on a 55t chart. It just takes a very long time when the market is open.

              So, only the offset issue remains.

              Thanks

              Comment


              • #8
                EFS does not update with each new Tick/bar -1 more Question

                Hi Alex,

                Regarding the thread: http://forum.esignalcentral.com/show...threadid=26086

                Just two issues;
                ---my version is offset forward by one bar when compared to the original version (as shown by the chart image when the lines cross).
                ---My version doesn't seem to load on tick charts such as the 55T. It just stays "Loading Data...' It only loads when trading for the particular stock/symbol is closed. Any ideas?

                Is there a way to have it match the original version and to have it load on Tick charts?

                Thanks
                (I reposted in case you didn't read my follow-up question - you help so many on the site so I know your time is valuable.)

                Comment


                • #9
                  Re: EFS does not update with each new Tick/bar

                  waynecd
                  I believe that the issue you are seeing is caused by your original script which is offsetting the plot backwards.
                  This is clearly visible in the snapshot you posted where you can see that the original script is not plotting on the last (ie most current) bar.
                  This is happening because in that script you are not using the sym() function to pass the symbols to the rsi() functions. The result is that both rsi() functions are being calculated on the chart's symbol and are returning the same values. So when in the macd() function you divide one series by the other using the equation vSig2/vSig1 you are in effect dividing the series by itself which returns a constant value of 1. As this is a value and not a series the macd() function interprets it as the bar index parameter and retrieves the value of the macd at bar index 1 ie that of the following bar (in other words offsetting back the plot by one period which is why there is no plot on the last bar as there is no data on following bar). This is also the reason why your original script does not work in real time.
                  Alex


                  Originally posted by waynecd
                  Alex,

                  I still haven't figured out how to get rid of the offset between the two studies but it does load on a 55t chart. It just takes a very long time when the market is open.

                  So, only the offset issue remains.

                  Thanks

                  Comment


                  • #10
                    Thank you for the info on how the original script calculated the values causing the offset. It will be very helpful in the future.

                    Any Idea why my version (updates in real time) does not load on Tick charts when the security is trading (market is open). I can only get it to load when there is no trading after hours.

                    Comment


                    • #11
                      Re: EFS does not update with each new Tick/bar -1 more Question

                      waynecd
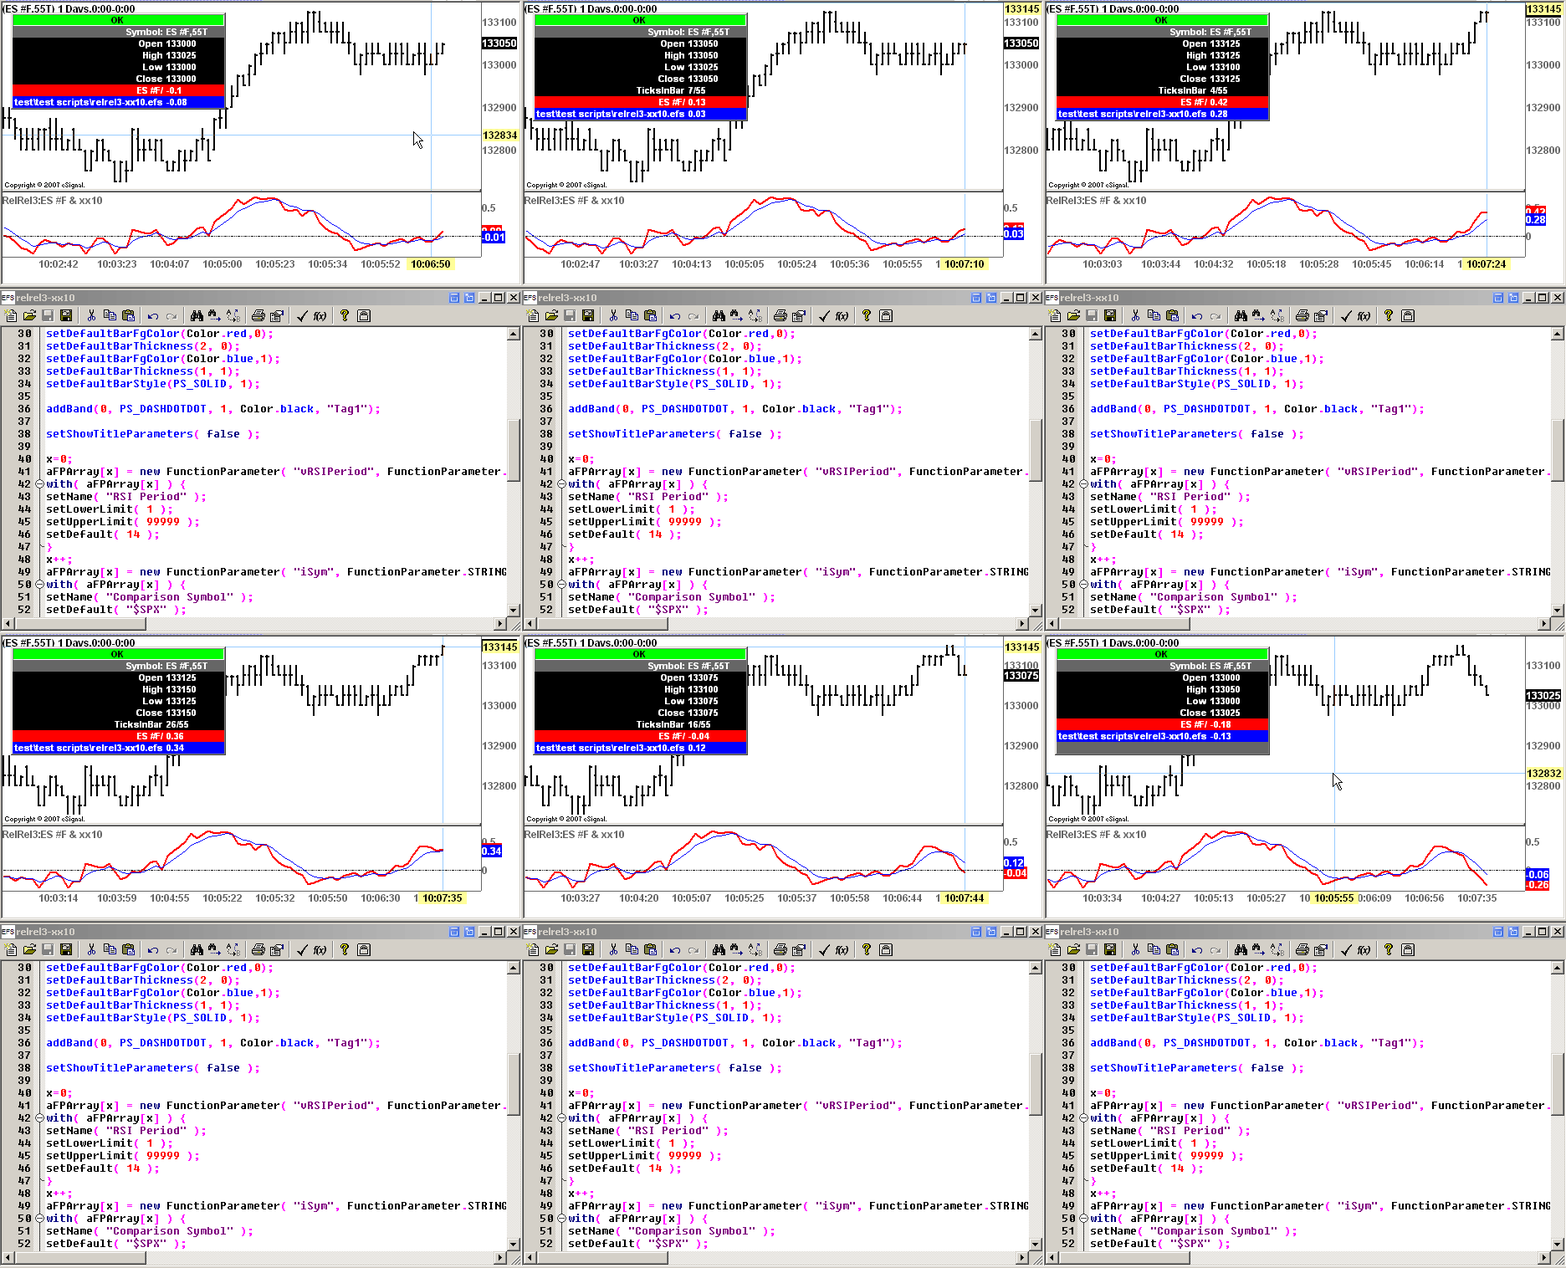
                      As far as I can see at my end the script is working also when the market is open (see enclosed animation)
                      You may want to verify that you are actually receiving tick data for the symbol called by the script (you can do this by opening a new chart for that symbol and interval). If you are not receiving the data then you may need to contact eSignal's support as this does not appear to be an efs issue.
                      FYI the thread has now been merged with the initial one. As suggested in the eSignal Central Forums Etiquette, Rules & Guidelines. please avoid creating multiple threads for the same topic.
                      Alex


                      Originally posted by waynecd
                      Thank you for the info on how the original script calculated the values causing the offset. It will be very helpful in the future.

                      Any Idea why my version (updates in real time) does not load on Tick charts when the security is trading (market is open). I can only get it to load when there is no trading after hours.

                      Comment

                      Working...
                      X