 Tweet
Tweet
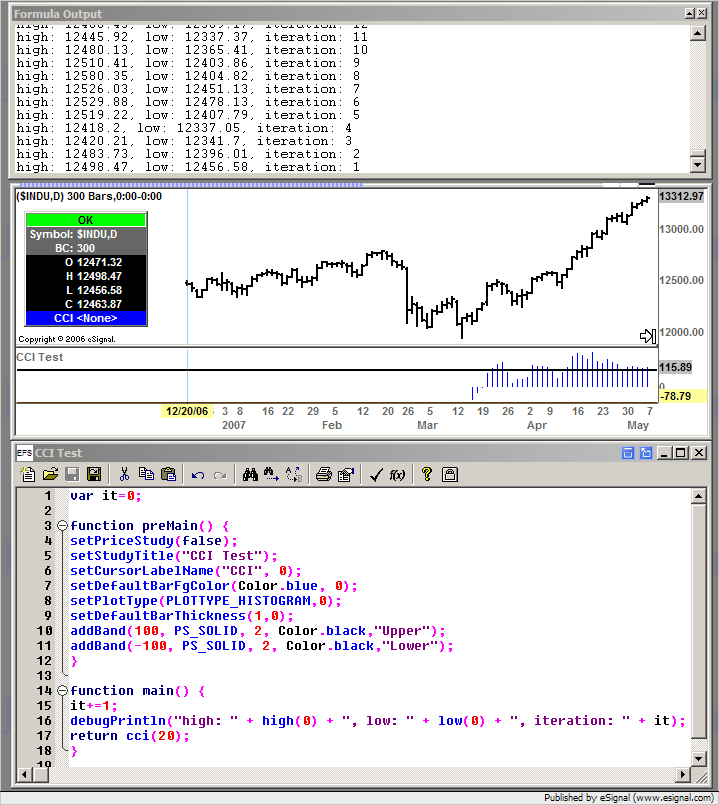
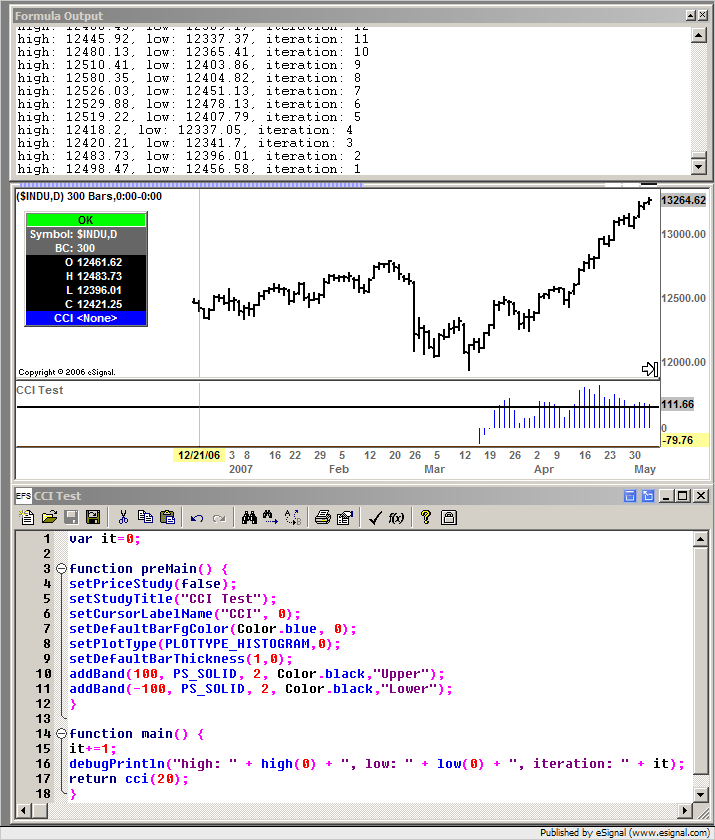
I have been writing a new script and have found that when the main is called it takes a certain period of time for calls to high(), low() and close() to return valid data.
I used the following script to produce this...
---------------------------------------------
var it=0;
function preMain() {
setPriceStudy(false);
setStudyTitle("CCI Test");
setCursorLabelName("CCI", 0);
setDefaultBarFgColor(Color.blue, 0);
setPlotType(PLOTTYPE_HISTOGRAM,0);
setDefaultBarThickness(1,0);
addBand(100, PS_SOLID, 2, Color.black,"Upper");
addBand(-100, PS_SOLID, 2, Color.black,"Lower");
}
function main() {
it+=1;
debugPrintln("high: " + high(0) + ", low: " + low(0) + ", iteration: " + it);
return cci(20);
}
---------------------------------------------
Around iteration 1315 the real values are being returned - on all previous calls values ranging from +/- 5 are returned.
Has anybody any idea why this might be happening?
Thanks.
Comment