Announcement

Collapse
No announcement yet.

Function math

Collapse
X
 
  • Filter
  • Time
  • Show
Clear All
new posts

  • Function math

    I have noticed that some esignal indicators display totally different to the same indicator on my other package, even when the parameters are set the same.

    I've looked at the efs code eg; the macd indicator, and it appears to call routines to do the math which I am assuming are in the function librarys ?

    Using the EFS editor, I can see 3 library modules in the library folder but they are password protected.

    Has anyone got the password ?

    I'd like to see the math that the efs indicator is using and compare it to the macd math of my other package to find out whats going on and why they are so different
  • #2
    Re: Function math

    Wiggle
    Which macd indicator are you referring to, the built-in functions [ie macd() macdSignal(), etc] or a specific efs?
    If the built-in functions then these are hard coded in the formula engine and do not make use of the function libraries. Keep in mind that the eSignal efs2 macd functions use only exponential averages which may be the reason for the differences you are seeing.
    If instead you are referring to a specific efs then you may want to provide the name of the efs and of the folder in which it is located - if this was installed with eSignal - or the link from where it was downloaded or the code itself so that someone can assist you with it
    Alex


    Originally posted by Wiggle
    I have noticed that some esignal indicators display totally different to the same indicator on my other package, even when the parameters are set the same.

    I've looked at the efs code eg; the macd indicator, and it appears to call routines to do the math which I am assuming are in the function librarys ?

    Using the EFS editor, I can see 3 library modules in the library folder but they are password protected.

    Has anyone got the password ?

    I'd like to see the math that the efs indicator is using and compare it to the macd math of my other package to find out whats going on and why they are so different

    Comment


    • #3
      Hi Alex
      its the macd that I add by clicking on a chart and selecting:

      Formulas/EFS2 Custom/customMACD2.efs

      I have added the indicator as an attachment.

      My other package uses the same parameters and exp ma's but still plots the macd very differently.

      Hence why I'd like to work out how this esignal macd indicator is calculated.

      thanks
      Attached Files

      Comment


      • #4
        Wiggle
        FWIW the script you attached is not the original customMACD.efs provided with eSignal but a version that has been modified to plot only the MACD Histogram ie the difference between the MACD and the MACD Signal.
        You may want to post a screenshot of the indicator as it is plotted by the other application as that may help in understanding where the differences may be
        Alex


        Originally posted by Wiggle
        Hi Alex
        its the macd that I add by clicking on a chart and selecting:

        Formulas/EFS2 Custom/customMACD2.efs

        I have added the indicator as an attachment.

        My other package uses the same parameters and exp ma's but still plots the macd very differently.

        Hence why I'd like to work out how this esignal macd indicator is calculated.

        thanks

        Comment


        • #5
          Wiggle
          As to how the MACD indicator is calculated in eSignal the MACD line is calculated as the difference between two exponential averages, the MACD Signal line is an exponential average of the MACD and the MACD Histogram is the difference between the MACD and the MACD Signal.
          Alex


          Originally posted by Wiggle
          Hi Alex
          its the macd that I add by clicking on a chart and selecting:

          Formulas/EFS2 Custom/customMACD2.efs

          I have added the indicator as an attachment.

          My other package uses the same parameters and exp ma's but still plots the macd very differently.

          Hence why I'd like to work out how this esignal macd indicator is calculated.

          thanks

          Comment


          • #6
            Hi Alex

            yes its just the macd histogram that I want to plot.

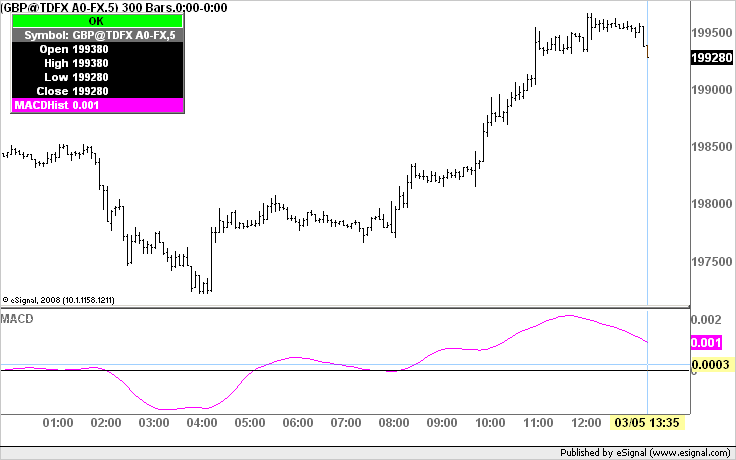
            I have added screen shots of the macd from the 2 platforms.

            One is esignal and the other is metatrader4. There will be slight differences in the datafeed but nothing that would cause the macd to differ as much as it is.

            As you can see the mt4 macd uses ema's also.

            thanks
            Bill
            Attached Files

            Comment


            • #7
              and here is the mt4 screen shot
              Attached Files

              Comment


              • #8
                Bill
                Based on the metatrader screenshot it seems to me that the application is using a simple moving average to calculate the Signal line and not an exponential average as in eSignal. Also I believe that the plot returned by metatrader is that of the Signal line (ie the average of the MACD) and not of the Histogram (ie the difference between the MACD and Signal lines).
                As I indicated in a previous reply the efs2 MACD functions only use exponential averages (even when calculating the Signal line). To base the Signal line on a simple moving average rather than the exponential modify the script you posted as follows. Replace
                xMACDSig = macdSignal(Fast, Slow,Smoothing, eval(Source)(sym(vSymbol)));
                with
                xMACDSig = sma(Smoothing,xMACD);
                and then replace
                return (getSeries(xMACDHist));
                with
                return (getSeries(xMACDSig));
                At this point you can also comment out or delete the line
                xMACDHist = macdHist(Fast, Slow,Smoothing, eval(Source)(sym(vSymbol)));
                as you would not be using it.
                Once you make the modifications save the script and apply it to the chart. It should plot as shown in the image enclosed below which is virtually the same as the one in metatrader
                Alex


                Originally posted by Wiggle
                Hi Alex

                yes its just the macd histogram that I want to plot.

                I have added screen shots of the macd from the 2 platforms.

                One is esignal and the other is metatrader4. There will be slight differences in the datafeed but nothing that would cause the macd to differ as much as it is.

                As you can see the mt4 macd uses ema's also.

                thanks
                Bill

                Comment


                • #9
                  Alexis

                  problem now sorted, excellent support as usual

                  thankyou

                  Comment


                  • #10
                    Bill
                    You are most welcome
                    Alex


                    Originally posted by Wiggle
                    Alexis

                    problem now sorted, excellent support as usual

                    thankyou

                    Comment

                    Working...
                    X