 Tweet
Tweet
Alex, thanks for helping me as i got the attached study to work. Prob is it slows down my esignal so much its hard to use on a small time frame. It works ok for 5 minute equities it seems but like 750V ER or 5000V ES it slows everything down to a crawl. Cant do anything with the chart. I upgraded to max 3G ram and still have problems. Can you or someone take a look at the scan and tell me if there is something i can do to make it work or is it just too cumbersome for that time frame. I do know Tradestation software supports this scan on the small time frames.
-
-
booker777
The reason why the study is taking up resources is because it is drawing the indicator on the chart (using the drawShapeRelative() function) instead of plotting it by returning its values which is considerably more efficient.
You could contact the author of the script (the user name in this forum is trader2be) and have him modify it or you can modify it yourself by implementing the following changes
The first thing you need to do is to return the item to the chart. You do this by changing the following line of code

to the following

As you can see I am now returning the dblMACD indicator as the second item of the return array.
Then you need to remove the command that is currently drawing the indicator. You can do this by either commenting out or deleting the following line of code (to comment out a line of code insert a double slash // at the beginning of the line)

At this point you need to set the color of the plot based on the conditions. To do this modify the following lines of code
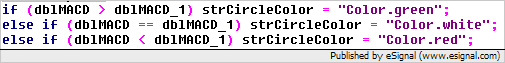
to the following

This now colors the plot by assigning the color to the second item of the return array
Lastly you need to assign the properties of the plot (type of plot, color, thickness, label name, etc). This is done in the preMain function where you need to modify these lines of code
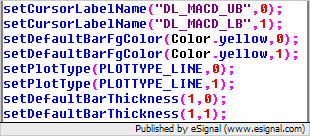
to the following
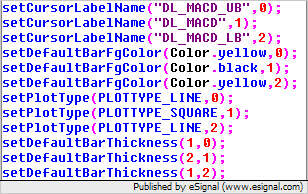
Once you make these changes the efs will be considerably more efficient
Alex
Originally posted by booker777
Alex, thanks for helping me as i got the attached study to work. Prob is it slows down my esignal so much its hard to use on a small time frame. It works ok for 5 minute equities it seems but like 750V ER or 5000V ES it slows everything down to a crawl. Cant do anything with the chart. I upgraded to max 3G ram and still have problems. Can you or someone take a look at the scan and tell me if there is something i can do to make it work or is it just too cumbersome for that time frame. I do know Tradestation software supports this scan on the small time frames.
Comment