 Tweet
Tweet
Hi-
Ive attached an existing script that I have been trying to alter to do the following:
Instead of showing the Hi-low, it would show the first bars, say 30 minutes , open and close with the prices labeled to the right as in the existing script.
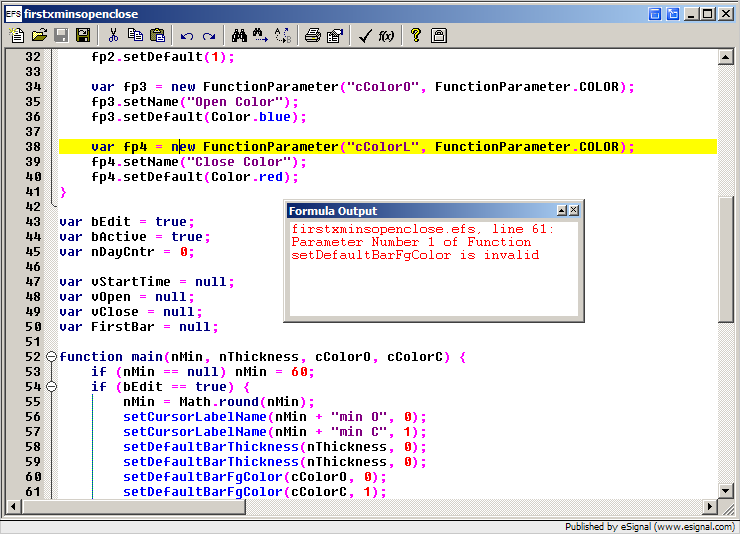
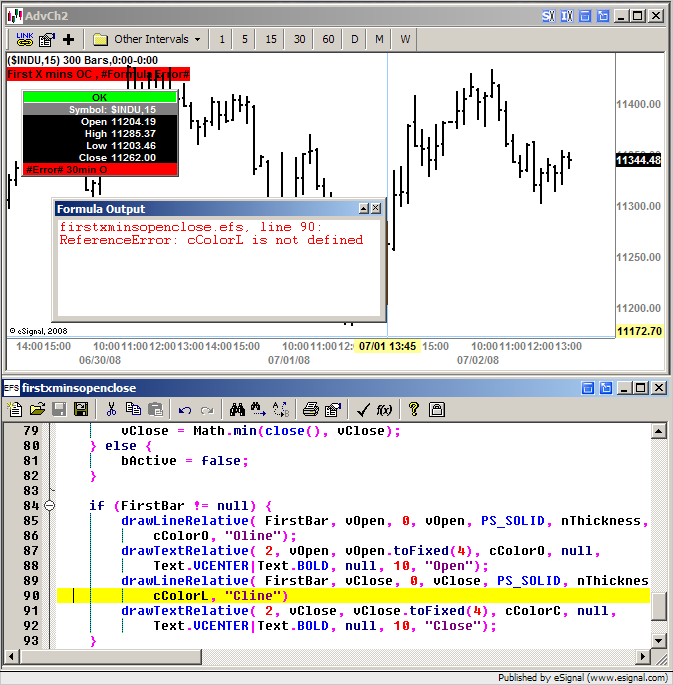
I've tried altering the script to acomplish this but I am getting an error each time.
Thanks for your help.
dido
Ive attached an existing script that I have been trying to alter to do the following:
Instead of showing the Hi-low, it would show the first bars, say 30 minutes , open and close with the prices labeled to the right as in the existing script.
I've tried altering the script to acomplish this but I am getting an error each time.
Thanks for your help.
dido
Comment