 Tweet
Tweet
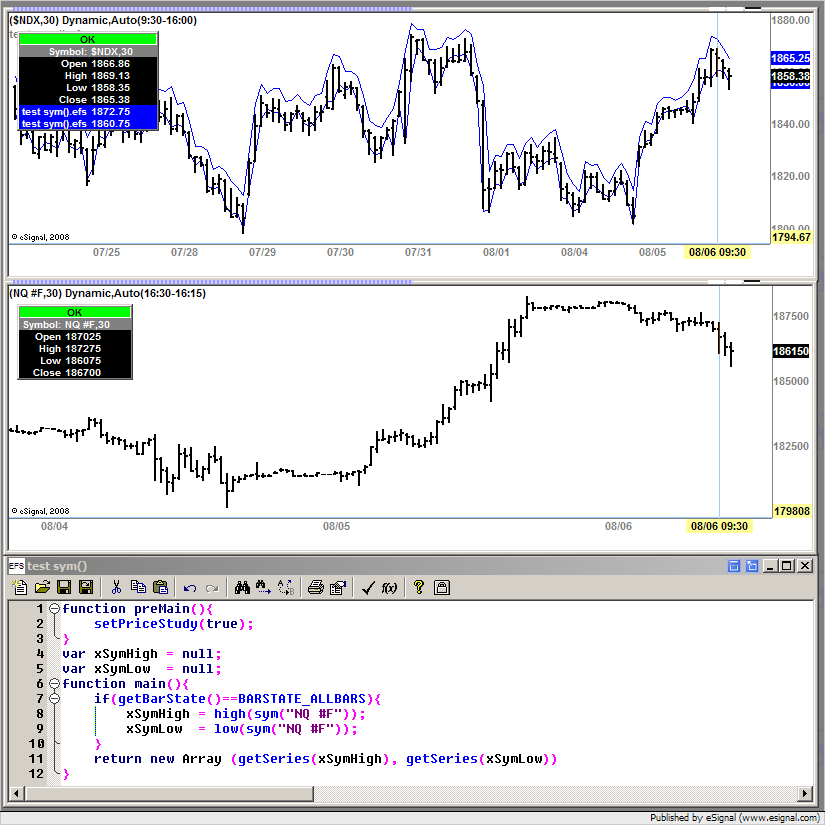
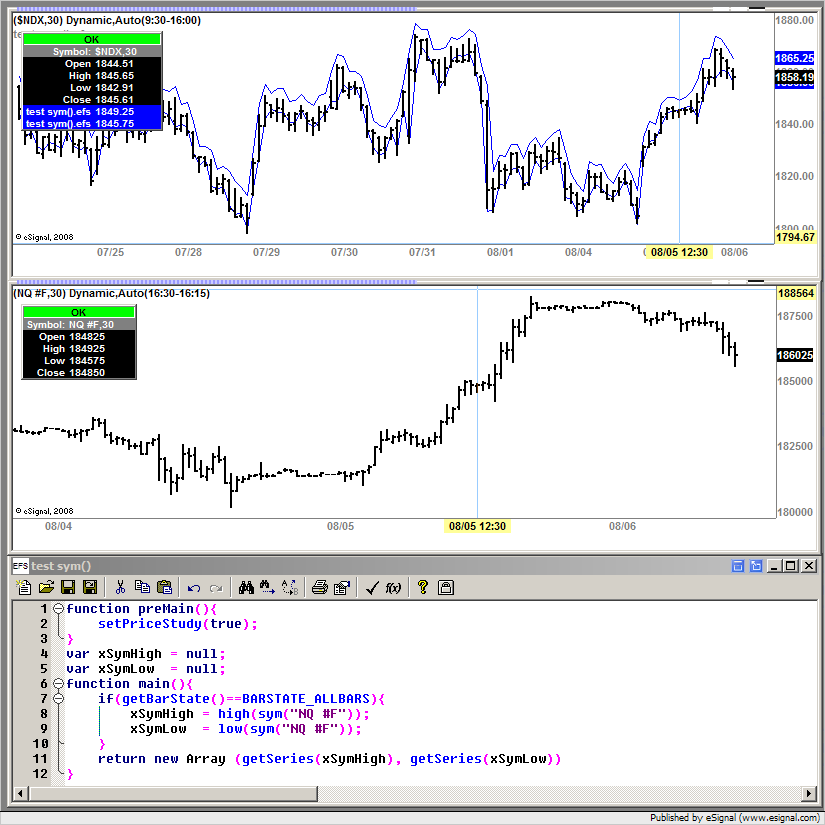
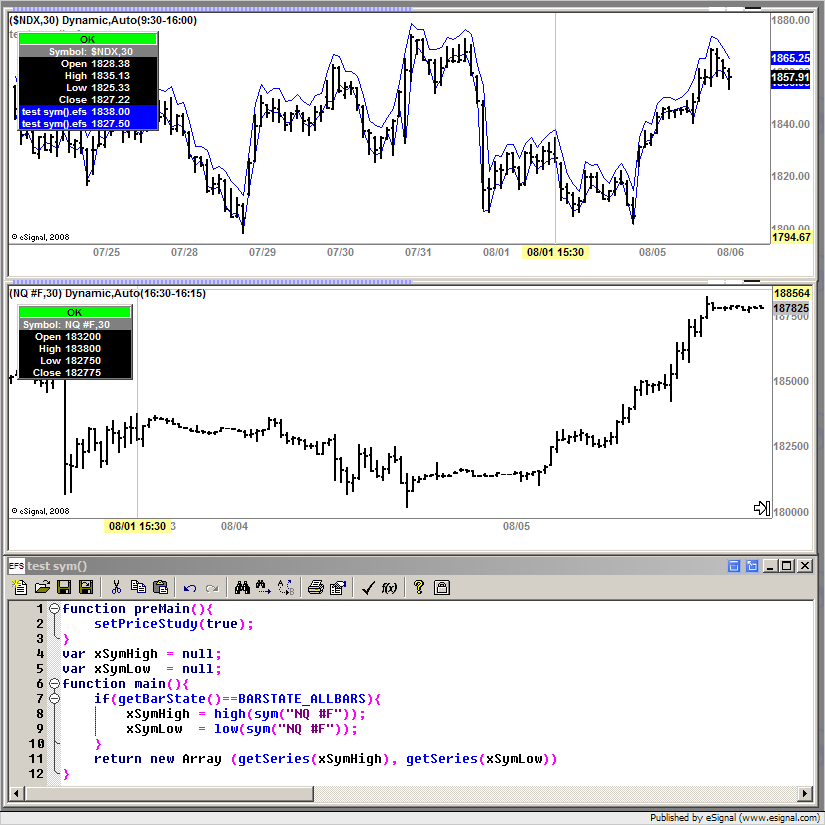
when using sym() to do multi-symbol analysis, if the time template is set to auto, while the secondary symbol is of different starting and ending trading time from that of the primary symbol when both using auto time template, the series created by sym(secondarySymbol) is not aligned with the that of the primary symbol. That is to say, when using sym() to do multiple symbol analysis, if the time template is set to auto, sym() gives incorrect results in many cases. For example, on $NDX chart, sym("NQ #F") could not align NQ #F data with $NDX bars correctly.
-
-
Re: sym()
clearpicks
They appear to be aligned at my end. Enclosed are three sets of screenshots with the cursor placed randomly on the $NDX chart and the values reported by the efs appear to match those of the external symbol (note that I tested it using also a fixed number of bars and days with identical results as those shown here using a Dynamic template)
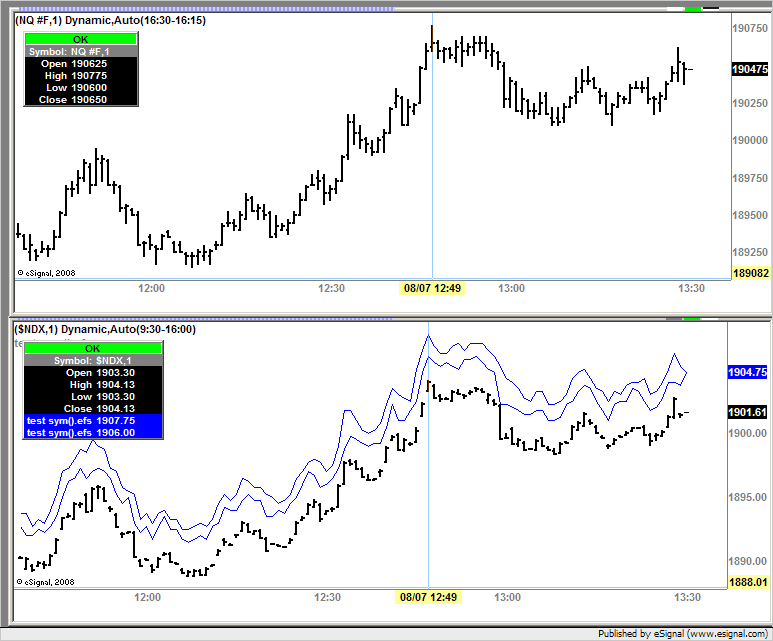
I also ran some tests in real time and even in this case the plots appeared to be asligned (see following screenshot which was captured after approximately an hour and a half of running in real time)
You may want to post the script you are using [or a working sample that illustrates the issue] and some screenshots in which the issue is visible
Alex
Originally posted by clearpicks
when using sym() to do multi-symbol analysis, if the time template is set to auto, while the secondary symbol is of different starting and ending trading time from that of the primary symbol when both using auto time template, the series created by sym(secondarySymbol) is not aligned with the that of the primary symbol. That is to say, when using sym() to do multiple symbol analysis, if the time template is set to auto, sym() gives incorrect results in many cases. For example, on $NDX chart, sym("NQ #F") could not align NQ #F data with $NDX bars correctly. -
Please apply the attached test script on "$NDX,5" chart with time template set to Dynamic, Auto.Comment
-
The screenshot. There is no volume data shown for days before yesterday.Attached FilesComment
-
-
clearpicks
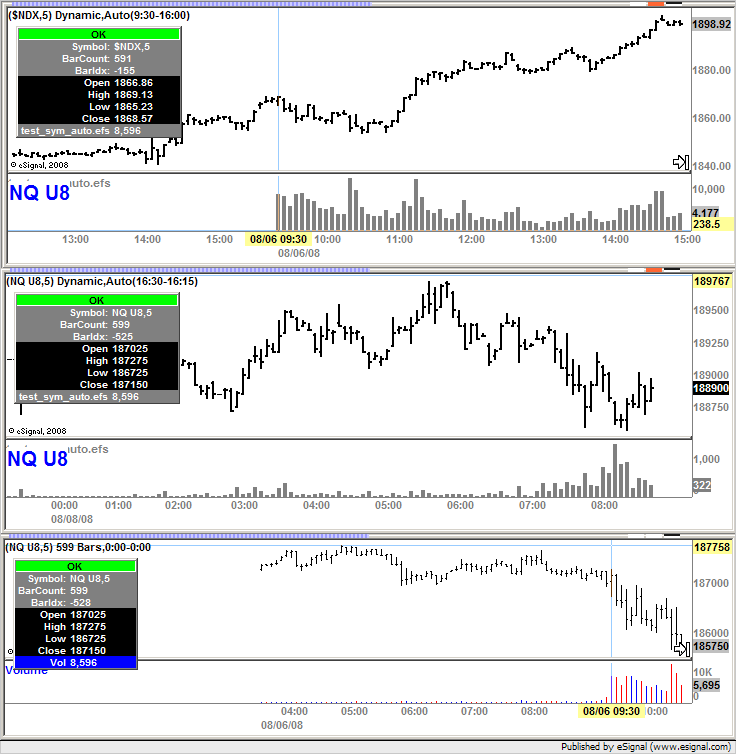
First of all I am not seeing any issues with alignement as you initially suggested. Even using your efs the plot is correctly aligned (ie synchronized) to the external symbol.
Without using setIntervalsBackfill() what you are seeing is what IMO should happen.There is no volume data shown for days before yesterday.
In the enclosed screenshot notice the BarCount value in the NQ U8 Dynamic Auto chart which is 599. You can then see in the bottom chart which is set to load 599 bars of NQ U8 that the earliest time stamp that is common to the $NDX and NQ U8 charts is in fact the 9:30 bar of 8/6 hence that is where the plot correctly ends (or begins depending on how you want to see it) when using sym("NQ U8") in the $NDX chart.
Alex
Originally posted by clearpicks
The screenshot. There is no volume data shown for days before yesterday.
Originally posted by clearpicks
Please apply the attached test script on "$NDX,5" chart with time template set to Dynamic, Auto.Comment
Comment