 Tweet
Tweet
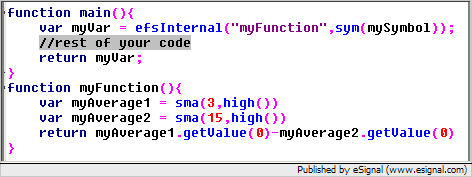
I load the following EFS on a chart of ym z8 on a 20t period. After several minuts if I reload the same EFS the line and values move as if it is calulating different prior values. Is there an error in the script? It should be the difference between two simple moving averages calculated on a 1 minute basis plotted on a 20t chart.
Best Regards,
Alan
setPriceStudy(false);
setStudyTitle(" Logic 96b");
setCursorLabelName("MA1", 0);
setDefaultBarStyle(PS_SOLID, 0);
setDefaultBarStyle(PS_SOLID, 1);
setDefaultBarStyle(PS_SOLID, 2);
setDefaultBarStyle(PS_SOLID, 3);
setDefaultBarFgColor(Color.blue, 0);
setDefaultBarFgColor(Color.black, 1);
setDefaultBarFgColor(Color.black, 2);
setDefaultBarFgColor(Color.black, 3);
setDefaultBarThickness(3, 0);
setDefaultBarThickness(1, 1);
setDefaultBarThickness(1, 2);
setDefaultBarThickness(1, 3);
setPlotType(PLOTTYPE_LINE, 0);
setPlotType(PLOTTYPE_LINE, 1);
setPlotType(PLOTTYPE_LINE, 2);
setPlotType(PLOTTYPE_LINE, 3);
Symbol1 = getSymbol();
Interval1 = "1";
}
function main() {
TT3 = 0;
WW3 = 25;
QQ3 = -25;
var vSymbol1 = Symbol1+","+Interval1;
if (bInit == false) {
xMA2 = eval(sma)(3,eval(high)(sym(vSymbol1)));
xMA4 = eval(sma)(15,eval(high)(sym(vSymbol1)));
}
if(getBarStateInterval("1")==BARSTATE_NEWBAR){

MA2 = xMA2.getValue(0);

MA4 = xMA4.getValue(0);

}
wer = MA2 - MA4;
return new Array (wer, TT3, QQ3, WW3);
}
Comment