Announcement

Collapse
No announcement yet.

difference in results

Collapse
X
 
  • Filter
  • Time
  • Show
Clear All
new posts

  • difference in results

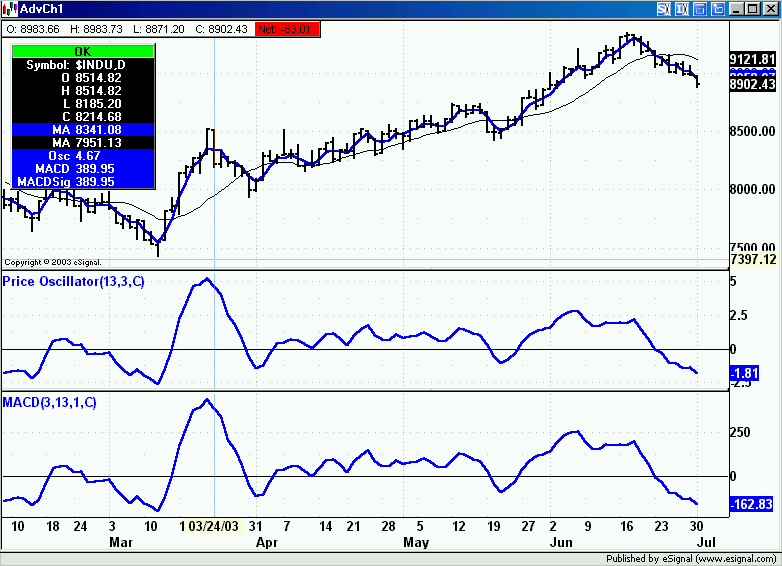
    I thought that the difference between a 3 sma and a 13 sma was basically the same as a 3-13 oscstudy, but when I see the actual lines of 2 sma's 3, 13 and I see the plotted 3-13 oscstudy, there is a much larger results between the difference of the 2 sma's and the results of the oscstudy.

    I am open for comments from anyone.

    EZ

  • #2
    I bet it has to do with the sma wma ema formulas.

    I think if you plot enough of them, you will see what the 3-13 osc is actually plotting.

    Comment


    • #3
      EZ
      They are actually the same except that for some reason the Price Oscillator returns a different numerical value.
      To confirm this plot the 3 and 13 simple MAs on the price chart and then a 3-13-1 MACD using simple MAs. If you subtract the value of 13MA from the 3MA the result should be the same as the MACD.
      Then plot a 3-13 Price Oscillator and compare its plot with that of the MACD. They should be identical in shape (see image below) even though the returned values are different.
      Alex

      Comment


      • #4
        It looks to me, that at lower price ranges it is an exact match, but as you start moving into prices they start to play games with dividing the results. For example with the $OEX it looks like they divide the results for the price osc by 2, with the $SPX it looks like a divide by 10 and with the $INDU it looks like a divide by 100.

        I'm not sure WHY they do this, but the results should look the same (ie: peak in the same places and cross the zero line in the same places).

        G
        Garth

        Comment

        Working...
        X