Announcement

Collapse
No announcement yet.

MA study code error

Collapse
X
 
  • Filter
  • Time
  • Show
Clear All
new posts

  • MA study code error

    Hi,

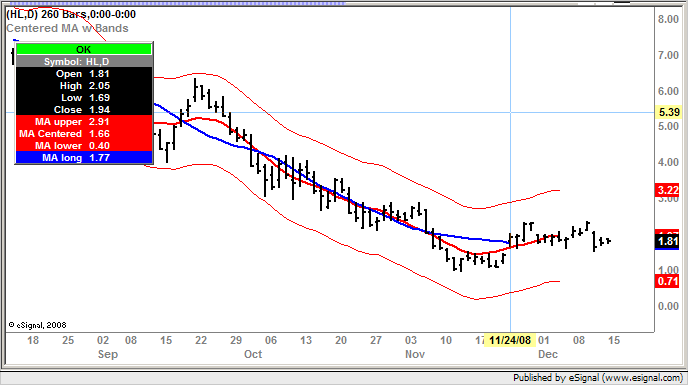
    I have written a study (the code is below) that basically plots two moving averages and offsets them backwards. One of the averages has envelopes as well. My issue is that I run this study on day bar charts with a time template of 260 bars. For some reason my average with the envelopes only shows for the first 12 bars and then stops plotting. I have tried a number of things and have been working on trying to solve this for about 2 days solid (I am new to efs programming and still learning) and have run into a dead end. I have no idea why the study will not work properly when there are no syntax errors. If someone could point our the errors or point me in a direction to resolving this I would greatly appreciate it.


    Also, I have tried to post an error message via the return statement as commented out below but have not been able to get this to work.

    var fnError = null;
    if(getNumBars() < BarLength) { // check that BarLength number of bars has loaded in the chart
    return fnError("Insufficient number of bars on chart.");

    Thank you very much for any help you may be able to provide.
    Regards,
    Jane

    function preMain() {
    setPriceStudy(true); // study plots in price pane (main chart)
    setStudyTitle("Centered MA w Bands");
    setShowTitleParameters(false);
    setShowCursorLabel(false); // supresses this study's label in cursor window

    setCursorLabelName("MA upper", 0);
    setDefaultBarFgColor(Color.red, 0);
    setDefaultBarThickness(1, 0);
    setPlotType(PLOTTYPE_LINE, 0);
    setShowCursorLabel(false, 0); //supresses this label in cursor window

    setCursorLabelName("MA Centered", 1);
    setDefaultBarFgColor(Color.red, 1);
    setDefaultBarThickness(2, 1);
    setPlotType(PLOTTYPE_LINE, 1);
    setShowCursorLabel(false, 1); //supresses this label in cursor window

    setCursorLabelName("MA lower", 2);
    setDefaultBarFgColor(Color.red, 2);
    setDefaultBarThickness(1, 2);
    setPlotType(PLOTTYPE_LINE, 2);
    setShowCursorLabel(false, 2); //supresses this label in cursor window

    setCursorLabelName("MA long", 3);
    setDefaultBarFgColor(Color.blue, 3);
    setDefaultBarThickness(2, 3);
    setPlotType(PLOTTYPE_LINE, 3);
    setShowCursorLabel(false, 3); //supresses this label in cursor window

    setComputeOnClose(); //force this script to only update on each new bar

    var fp1 = new FunctionParameter("BarLength", FunctionParameter.NUMBER);
    fp1.setName("BarLength");
    fp1.setLowerLimit(1);
    fp1.setDefault(260); // default number of bars
    var fp2 = new FunctionParameter("MA_Length1", FunctionParameter.NUMBER);
    fp2.setName("MA_Length1");
    fp2.setLowerLimit(1);
    fp2.setDefault(13); // default length for fast MA
    var fp3 = new FunctionParameter("MA_Length2", FunctionParameter.NUMBER);
    fp3.setName("MA_Length2");
    fp3.setLowerLimit(1);
    fp3.setDefault(27); // default length for slow MA
    }

    // Global Variables
    var vMA1 = null;
    var vMA2 = null;
    var vBands = null;
    var bInit = false;

    function main(BarLength, MA_Length1, MA_Length2) {
    var fnError = null;
    if(getNumBars() < BarLength) { // check that BarLength number of bars has loaded in the chart
    // return fnError("Insufficient number of bars on chart.");
    drawTextPixel( 50, 50,"Insufficient number of bars on chart.", Color.red, null, Text.RELATIVETOLEFT | Text.RELATIVETOBOTTOM | Text.BOLD, "Name" ,10, -10 );
    return;
    }
    if(!bInit) {
    vBands = efsInternal("calcBands", BarLength, MA_Length1);
    bInit = true;
    }
    var offset1 = Math.floor(MA_Length1*0.5);
    var offset2 = Math.floor(MA_Length2*0.5);
    if (vMA1 == null) vMA1 = sma(MA_Length1, hl2());
    if (vMA2 == null) vMA2 = sma(MA_Length2, hl2());

    /*
    for(var j = 0; j <= dif; j++) {
    var hMax = high(-j);
    var lMax = low(-j);
    if(hMax > highMax) highMax = hMax;
    if(lMax < lowMax) lowMax = lMax;
    }
    */
    var MA_upper = offsetSeries(getSeries(vBands), -offset1);
    var MA_center = offsetSeries(getSeries(vBands,1), -offset1);
    var MA_lower = offsetSeries(getSeries(vBands,2), -offset1);
    var MA_long = offsetSeries(getSeries(vMA2), -offset2);
    return new Array(MA_upper, MA_center, MA_lower, MA_long);
    }

    // Global Variables
    var vMA1 = null;

    //== calcBands function calculates the value of the bands about the centered moving average
    function calcBands(BarLength, MA_Length1) {
    if (vMA1 == null) vMA1 = sma(MA_Length1, hl2());
    var sumHi = 0;
    var sumLo = 0;
    var envSize = 0;
    var medianPrice = 0;
    var nUpper = null;
    var nLower = null;
    var offset1 = Math.floor(MA_Length1*0.5);
    var dif = offset1-BarLength;
    for(var i = dif; i < 1; i++) {
    medianPrice = 0.5*(high(i)+low(i));
    sumHi += Math.pow((high(i)-medianPrice), 2);
    sumLo += Math.pow((medianPrice-low(i)), 2);
    }
    envSize = 4.5*Math.sqrt(Math.max(sumHi, sumLo)/(-dif));
    var nMA = vMA1.getValue(0);
    if(nMA == null) return;
    nUpper = nMA+envSize;
    nLower = nMA-envSize;
    return new Array(nUpper,nMA,nLower);
    }
  • #2
    Hi,

    I have just discovered that the problem is due to the for loop in the function calcBands.

    If the for loop is changed from:
    for(var i = dif; i < 1; i++) {

    to:
    for(var i = -6; i < 1; i++) {

    I get a plot of the MAs even the bands. The number of bars plotted depends on the starting value of i in the for loop. I am really confused now.
    Regards,
    Jane

    Comment


    • #3
      Jane
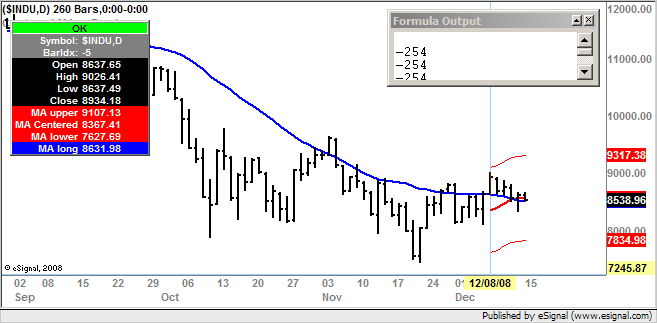
      In debugging your script you may want to initially set all the offsets to 0 [rather than negative] so that you can better verify when the studies actually begin to plot. Apply the offset only once you have determined that they are working as intended.
      Also add some debug statements so as to make sure that you are getting the expected values. For example if you added
      debugPrintln(dif)
      in the function calcBands right after the line in which you calculate the value of the variable dif you will see that it is returning -254
      I don't know if this is the value you are expecting however it does mean that it will take 254 bars before the study is going to return the value of the bands to the chart. Assuming you set the offset to 0 as I suggested above bar index -5 will be the first bar [on a chart set to load 260 bars] in which high(-i) and low(-i) will return a value in your loop (they will be null before that)
      As you do the above you will see that the study is in effect returning the values of the bands to the chart at the appropriate bar ie at bar index -5 and plots for 6 bars because 260-254 = 6 (note that I removed the setComputeOnClose() statement for the purpose of this test)
      This is why when you changed in your loop the value of dif to -6 the study appeared to be working as you were expecting it to because instead of calculating over 254 bars it was now calculating over 5 bars. Note that the bands would still begin 13 bars from the first one because that is the number of bars required by the average
      Hope this helps
      Alex

      Comment


      • #4
        Hi,

        I have also discovered that if I get rid of the time template and have a dynamic template, the script will run but needs 242 bars before it starts plotting. So, since I want to use a time template with 260 bars, I would need to go through all the bars once, calculate the resultd of the for loop and then make a second pass through the bars using the calculated value. Does anyone know how to do this? I am thinking of using reloadefs but am concerned that it will not hold the previously calculated result. I am also concerned that the reload may generate other problems. Does anyone know how to make multiple passes through an efs script and retain the values generated in the previous passes? Any help would be greatly appreciated. Thank you.
        Regards,
        Jane

        Originally posted by jg
        Hi,

        I have just discovered that the problem is due to the for loop in the function calcBands.

        If the for loop is changed from:
        for(var i = dif; i < 1; i++) {

        to:
        for(var i = -6; i < 1; i++) {

        I get a plot of the MAs even the bands. The number of bars plotted depends on the starting value of i in the for loop. I am really confused now.
        Regards,
        Jane

        Comment


        • #5
          Hi Alex,

          Thank you very much for your helpful suggestions. I will follow through on them. I think, however, that perhaps my thinking here is the problem. What I really want to do is to load 260 bars into a chart (via a time template). Then I want the efs script to run through the loaded bars and calculate the result of the for loop (it calculates the width of the envelope for one of the moving averages). Then, on the next pass, I want the efs to calculate the moving average and apply the envelope width calculated so that I get the moving averages plotted on the 260 bars without having to wait 254 bars before the average with the envelopes starts plotting, and have the averages and envelope update as new bars are added. I hope this makes sense. I am looking into using reloads efs but am not sure of how it is to be used and whether it will retain the results from the previous pass of the efs.
          Thank you very much for your assistance. It is greatly appreciated.

          Also, Alex, -254 is the correct value for dif. The logic was that if I load 260 bars into a chart that I would be able to looop through 254 historical bars to calculate the envelope width and plot an envelope with my moving average.

          Regards,
          Jane

          Originally posted by Alexis C. Montenegro
          Jane
          In debugging your script you may want to initially set all the offsets to 0 [rather than negative] so that you can better verify when the studies actually begin to plot. Apply the offset only once you have determined that they are working as intended.
          Also add some debug statements so as to make sure that you are getting the expected values. For example if you added
          debugPrintln(dif)
          in the function calcBands right after the line in which you calculate the value of the variable dif you will see that it is returning -254
          I don't know if this is the value you are expecting however it does mean that it will take 254 bars before the study is going to return the value of the bands to the chart. Assuming you set the offset to 0 as I suggested above bar index -5 will be the first bar [on a chart set to load 260 bars] in which high(-i) and low(-i) will return a value in your loop (they will be null before that)
          As you do the above you will see that the study is in effect returning the values of the bands to the chart at the appropriate bar ie at bar index -5 and plots for 6 bars because 260-254 = 6 (note that I removed the setComputeOnClose() statement for the purpose of this test)
          This is why when you changed in your loop the value of dif to -6 the study appeared to be working as you were expecting it to because instead of calculating over 254 bars it was now calculating over 5 bars. Note that the bands would still begin 13 bars from the first one because that is the number of bars required by the average
          Hope this helps
          Alex

          Comment


          • #6
            Hi Alex,

            Thank you very much for helping me clarify my thoughts as to what I really wanted the script to do. I was able to get the code working the way I wanted using reloadEFS(). The code is below. My only question is if there is a more efficient way of doing this. Thank you for all your help.

            P.S. I would include a screen shot but I don't know how to:
            1. upload an image to the forum post
            2. upload the efs code rather than pasting it into my reply

            function preMain() {
            setPriceStudy(true); // study plots in price pane (main chart)
            setStudyTitle("Centered MA w Bands");
            setShowTitleParameters(false);
            setShowCursorLabel(false); // supresses this study's label in cursor window

            setCursorLabelName("MA upper", 0);
            setDefaultBarFgColor(Color.red, 0);
            setDefaultBarThickness(1, 0);
            setPlotType(PLOTTYPE_LINE, 0);
            setShowCursorLabel(false, 0); //supresses this label in cursor window

            setCursorLabelName("MA Centered", 1);
            setDefaultBarFgColor(Color.red, 1);
            setDefaultBarThickness(2, 1);
            setPlotType(PLOTTYPE_LINE, 1);
            setShowCursorLabel(false, 1); //supresses this label in cursor window

            setCursorLabelName("MA lower", 2);
            setDefaultBarFgColor(Color.red, 2);
            setDefaultBarThickness(1, 2);
            setPlotType(PLOTTYPE_LINE, 2);
            setShowCursorLabel(false, 2); //supresses this label in cursor window

            setCursorLabelName("MA long", 3);
            setDefaultBarFgColor(Color.blue, 3);
            setDefaultBarThickness(2, 3);
            setPlotType(PLOTTYPE_LINE, 3);
            setShowCursorLabel(false, 3); //supresses this label in cursor window

            setComputeOnClose(); //force this script to only update on each new bar

            var fp1 = new FunctionParameter("BarLength", FunctionParameter.NUMBER);
            fp1.setName("BarLength");
            fp1.setLowerLimit(1);
            fp1.setDefault(260); // default number of bars
            var fp2 = new FunctionParameter("MA_Length1", FunctionParameter.NUMBER);
            fp2.setName("MA_Length1");
            fp2.setLowerLimit(1);
            fp2.setDefault(13); // default length for fast MA
            var fp3 = new FunctionParameter("MA_Length2", FunctionParameter.NUMBER);
            fp3.setName("MA_Length2");
            fp3.setLowerLimit(1);
            fp3.setDefault(27); // default length for slow MA
            }

            // Global Variables
            var vMA1 = null;
            var vMA2 = null;
            var vBands = null;
            var offset1 = null;
            var offset2 = null;
            var envSize = null;
            var dif = null;
            var bInit = false;
            var reload = true;

            function main(BarLength, MA_Length1, MA_Length2) {
            if(getNumBars() < BarLength) { // check that BarLength number of bars has loaded in the chart
            drawTextAbsolute(50, 35, "Insufficient number of bars on chart.", Color.red, null, Text.RELATIVETOLEFT|Text.RELATIVETOBOTTOM|Text.BOL D, null, 14, "Error Msg");
            return;
            }
            // reload
            if(reload) {
            var sumHi = 0;
            var sumLo = 0;
            var medianPrice = 0;
            offset1 = Math.floor(MA_Length1*0.5);
            offset2 = Math.floor(MA_Length2*0.5);
            dif = offset1-BarLength;
            for(var i = dif; i <= 0; i++) {
            medianPrice = 0.5*(high(i)+low(i));
            sumHi += Math.pow((high(i)-medianPrice), 2);
            sumLo += Math.pow((medianPrice-low(i)), 2);
            }
            envSize = 4.5*Math.sqrt(Math.max(sumHi, sumLo)/(-dif));
            reload = false;
            reloadEFS();
            return;
            }
            if(!bInit) {
            offset1 = Math.floor(MA_Length1*0.5);
            offset2 = Math.floor(MA_Length2*0.5);
            dif = offset1-BarLength;
            vBands = efsInternal("calcBands", MA_Length1, dif, offset1, envSize);
            bInit = true;
            }
            if (vMA1 == null) vMA1 = sma(MA_Length1, hl2());
            if (vMA2 == null) vMA2 = sma(MA_Length2, hl2());

            /*
            for(var j = 0; j <= dif; j++) {
            var hMax = high(-j);
            var lMax = low(-j);
            if(hMax > highMax) highMax = hMax;
            if(lMax < lowMax) lowMax = lMax;
            }
            */
            var MA_upper = offsetSeries(getSeries(vBands), -offset1);
            var MA_center = offsetSeries(getSeries(vBands,1), -offset1);
            var MA_lower = offsetSeries(getSeries(vBands,2), -offset1);
            var MA_long = offsetSeries(getSeries(vMA2), -offset2);
            return new Array(MA_upper, MA_center, MA_lower, MA_long);
            }

            // Global Variables
            var vMA1 = null;

            //== calcBands function calculates the value of the bands about the centered moving average
            function calcBands(MA_Length1, dif, offset1, envSize) {
            if (vMA1 == null) vMA1 = sma(MA_Length1, hl2());
            var sumHi = 0;
            var sumLo = 0;
            var medianPrice = 0;
            var nUpper = null;
            var nLower = null;
            if(getCurrentBarIndex() >= offset1) {
            envSize = 0;
            for(var i = dif; i <= 0; i++) {
            medianPrice = 0.5*(high(i)+low(i));
            sumHi += Math.pow((high(i)-medianPrice), 2);
            sumLo += Math.pow((medianPrice-low(i)), 2);
            }
            envSize = 4.5*Math.sqrt(Math.max(sumHi, sumLo)/(-dif));
            }
            var nMA = vMA1.getValue(0);
            if(nMA == null) return;
            nUpper = nMA+envSize;
            nLower = nMA-envSize;
            return new Array(nUpper, nMA, nLower);
            }

            Comment


            • #7
              Hi jg,

              FWIW, on your two questions regarding forum posts:

              1) here is link to an Alex post on posting images.

              2) To post code, surround the code with php tags by selecting the PHP button on the Post Reply screen.

              Here is a great link to the vB Code [help] that explains much about the different techniques. This link is on the Post Reply screen that you use when posting a forum reply.

              Comment


              • #8
                Hi Alex,

                One final question on this subject if I may. The script works but I noticed that it plots a thin horizontal blue line at 0. I have no idea where this line is coming from. If you could shed some light on this it would be greatly appreciated. I must be missing something. Thank you very much.

                Regards,
                Jane

                P.S. I tried to attach an image but it was too big. I am looking into the file share option suggested in the posts from Steve.

                Comment


                • #9
                  Jane
                  I am not seeing any horizontal blue line at 0 (see enclosed screenshot). Just to make sure I also enabled the cursor labels and nothing appears to be returned by the efs at 0
                  Alex


                  Originally posted by jg
                  Hi Alex,

                  One final question on this subject if I may. The script works but I noticed that it plots a thin horizontal blue line at 0. I have no idea where this line is coming from. If you could shed some light on this it would be greatly appreciated. I must be missing something. Thank you very much.

                  Regards,
                  Jane

                  P.S. I tried to attach an image but it was too big. I am looking into the file share option suggested in the posts from Steve.

                  Comment


                  • #10
                    Hi Alex,
                    My apologies for the delay in this response but had doctors' appointments yesterday. My mistake. The line came from another efs plotting a value 0 instead of null for a variable. Many thanks for all your invaluable help. It is much appreciated.
                    Jane

                    The
                    Originally posted by Alexis C. Montenegro
                    Jane
                    I am not seeing any horizontal blue line at 0 (see enclosed screenshot). Just to make sure I also enabled the cursor labels and nothing appears to be returned by the efs at 0
                    Alex

                    Comment


                    • #11
                      Hi Alex,
                      The thin line came from the fact that in my main I used:
                      return 0;
                      instead of simply
                      return;

                      This goes back to my C and C++ days. It was interesting that the efs would plot the value 0. Speaking of this, is there a need to return codes from the main? Also, what is the proper syntax for the return statement? Thanks for all that you do. I really don't know how to thank you enough.
                      Regards,
                      Jane


                      Originally posted by jg
                      Hi Alex,
                      My apologies for the delay in this response but had doctors' appointments yesterday. My mistake. The line came from another efs plotting a value 0 instead of null for a variable. Many thanks for all your invaluable help. It is much appreciated.
                      Jane

                      The

                      Comment


                      • #12
                        Jane
                        You can find the explanation of why the 0 was plotted together with the answers to your questions in the section on the return statement of the Tutorial 2: Commonly Used Core JavaScript which is in the Help Guides and Tutorials-> Beginner Tutorials folder of the EFS KnowledgeBase
                        Alex


                        Originally posted by jg
                        Hi Alex,
                        The thin line came from the fact that in my main I used:
                        return 0;
                        instead of simply
                        return;

                        This goes back to my C and C++ days. It was interesting that the efs would plot the value 0. Speaking of this, is there a need to return codes from the main? Also, what is the proper syntax for the return statement? Thanks for all that you do. I really don't know how to thank you enough.
                        Regards,
                        Jane


                        Comment

                        Working...
                        X