Hi,
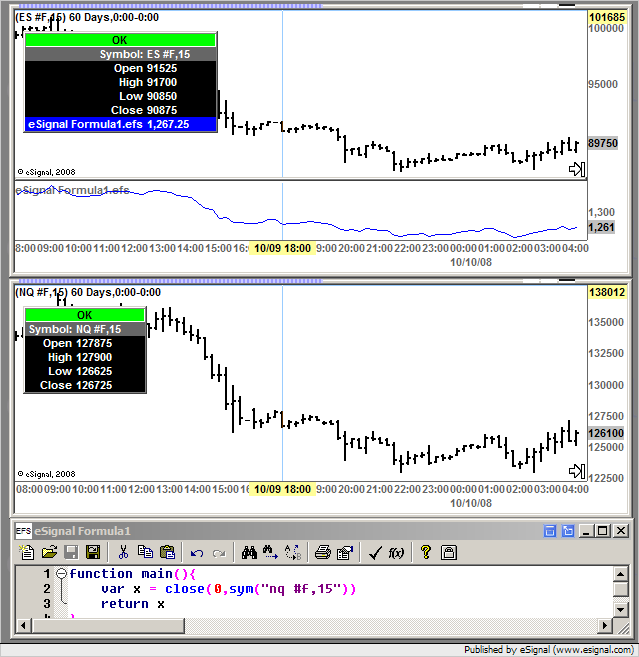
I'm trying to show on "ES #F" chart values from diferent symbols and I have several problems.
1. If I show close(0,"NQ #F,15") on my ES 15min chart I get diferent values as in NQ chart and before November 3 I get no values at all. I draged the NQ chart and there I do see the bars.
2. With close(0,sym("$UVOL,15")) I get the correct values but still before November 3 no values.
Please HELP.
Baruch

Comment