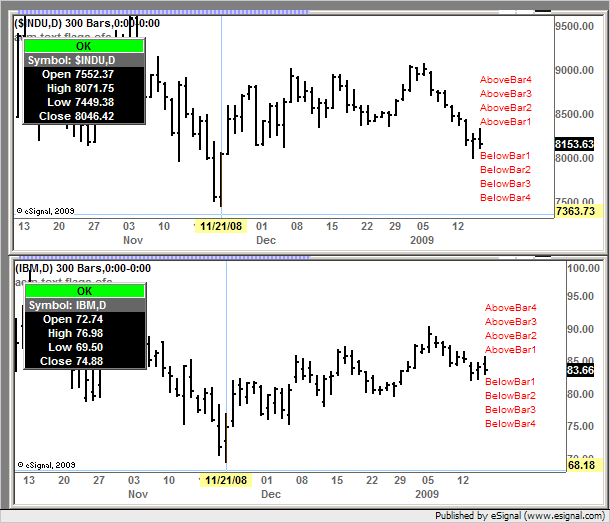
I'm having trouble when it comes to printing a text object on my chart. It's not that I am having trouble with the Text showing up. My problem lies in the fact that I want the text to appear a certain percentage either above or below the candle on the chart when the condition is triggered. Currently I have it as follows:
drawTextRelative(-1, high()+0.10, "S", Color.RGB(255,0,0), Color.RGB(255,255,0), Text.BOLD, "Arial", 14)
and
drawTextRelative(0, low()-0.10, "B", Color.RGB(0,0,255), Color.RGB(255,255,0), Text.BOLD, "Arial", 14)
I have it so that the text "S" prints 10cents above the current high of the candle, and the "B" 10cents below the current low of the candle. So as to not interfere or block the view of the candle forming on the chart.
What I would like to have it do is print the "S" at say 1% of the stock's price above the high of the candle. So that the distance above or below the candle where the text prints is uniform across stocks with very different price ranges. ex. GOOG vs F, or SPY vs ETFC.
I know there has to be a way to do this but it is driving me crazy. Every time I add a "%" sign into the formula I get a syntax error. For example I would like it to be like this:
drawTextRelative(-1, high()+1%, "S", Color.RGB(255,0,0), Color.RGB(255,255,0), Text.BOLD, "Arial", 14)
Can someone please help me figure this out. I trade a bunch of different stocks at very different price levels and sometime the "S" or "B" that pops up is right smack on top of the candle stick in my chart if it is a very high price stock, but if it is a low priced stock say Ford, sym=F then the "S" or "B" that pops up is not even on my chart because it is beyond the scale of the chart.
There has to be a way to do this so that the "S" or "B" text pops up consistently a certain distance away from the candle stick on the chart regarless if the stock's price is $300 or $3.
Please help!! Thanks in advance.

Comment