 Tweet
Tweet
Hi
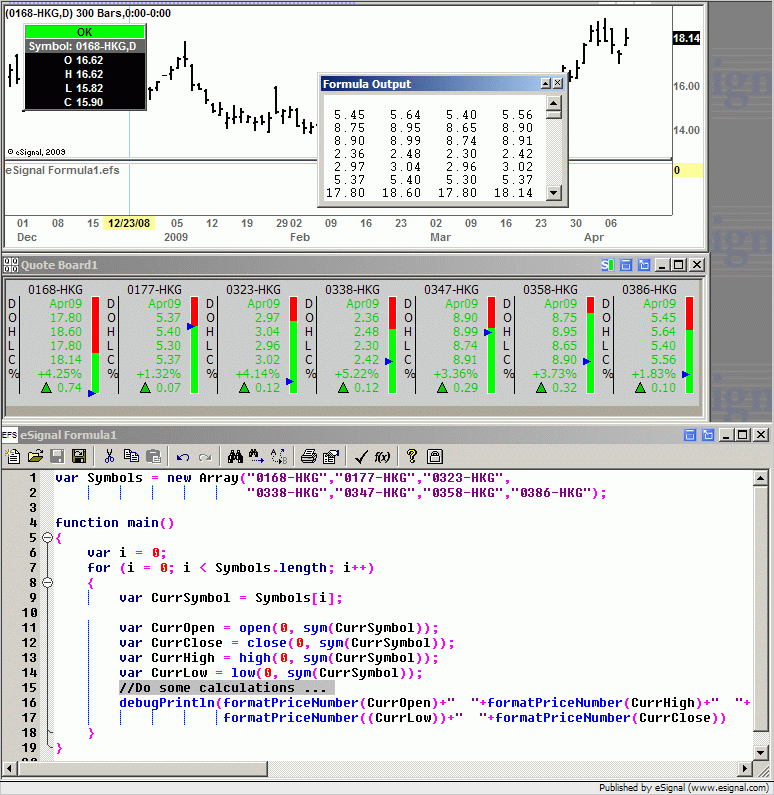
I have an EFS script that compares daily/minute charts of a list of symbols.
Here's how it looks like:
var Symbols = new Array("0168-HKG", "0177-HKG", "0323-HKG", "0338-HKG", "0347-HKG", "0358-HKG", "0386-HKG");
function main()
{
var i = 0;
for (i = 0; i < Symbols.length; i++)
{
var CurrSymbol = Symbols[i];
var CurrOpen = open(0, sym(CurrSymbol));
var CurrClose = close(0, sym(CurrSymbol));
var CurrHigh = high(0, sym(CurrSymbol));
var CurrLow = low(0, sym(CurrSymbol));
//Do some calculations ...
}
}
I run the script in daily charts and 60 minute charts resided in a same page. There will be ~ 14 instances of the script running simultaneously each time.
The problem is that from time to time, the script will hang at the mid-pont of running. The points at which they hang vary each time but seems that they are always in the 60 minute charts. The message freezed in the study pane of the chart window is "Data Loading ..." and there is no effect for reloading the script.
What is worse is that after the script hanged, the 60-minute charts of the symbols having been loaded by the scripts seem to have problem rendering. The charts are either incomplete or simply blank. It looks like that the symbols are permernantly stuck.
Is there anyone encountered the same problem?
Thanks.
Comment