Announcement

Collapse
No announcement yet.

drawing tools

Collapse
X
 
  • Filter
  • Time
  • Show
Clear All
new posts

  • drawing tools

    I've been playing with the setBarBGColor() function as well as others and I have some dumb questions???

    Is there a limit as to the "layers" that can be passed into this function??

    I find that if I get above 3, the shading is not drawn on the chart.

    Also, are any changes in future versions going to further address these "layers" for drawing. It would be nice to be able to assign different layers for different drawing features (like buttons, trading system results, indicators or other values, lines, shapes).

    Anyway, my current question is what are the practical limitations of these "layers" for this function and why am I running into a limit when I try to draw on layer 4??

    B
    Brad Matheny
    eSignal Solution Provider since 2000

  • #2
    here is an example of what I'm running into. It stops drawing after the third level... so I think there is an internal limit? no?
    Attached Files
    Brad Matheny
    eSignal Solution Provider since 2000

    Comment


    • #3
      Re: drawing tools

      Brad
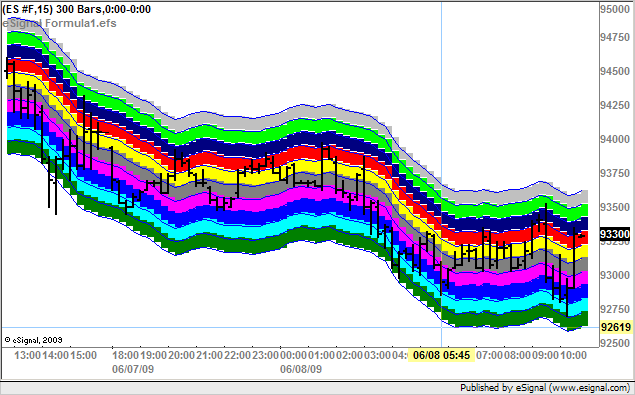
      I am not aware of any limitation provided you assign each background color to a different element of the return array.
      In the enclosed screenshot you can see I am using 10 different background colors
      Alex


      Originally posted by Doji3333
      here is an example of what I'm running into. It stops drawing after the third level... so I think there is an internal limit? no?

      Comment


      • #4
        Thanks Alex.

        So the "level" (as I'm calling them) have to be related to the returned items in the cursor window - eh?

        I thought it was related to a "drawing pane" on the chart (like in other languages).

        I guess that explains it because I wanted to shade the background of a chart without having to populate the cursor window with a bunch of data.

        Maybe this is something esignal can try to achieve in a future version? Having these elements related to the cursor window means we might have to "over populate" the cursor window to achieve desired graphic results.

        BTW, after I ran into these problems, I simply gave up on the graphics portion of the code and developed the required logic for my system.
        Brad Matheny
        eSignal Solution Provider since 2000

        Comment


        • #5
          Brad

          So the "level" (as I'm calling them) have to be related to the returned items in the cursor window - eh?
          As far as I know that has always been the case since the additional parameters were introduced

          Having these elements related to the cursor window means we might have to "over populate" the cursor window to achieve desired graphic results.
          Not necessarily. You can control what is displayed in the Cursor Window using the setShowCursorLabel() function (see the related article in the EFS KnowledgeBase)
          Alex


          Originally posted by Doji3333
          Thanks Alex.

          So the "level" (as I'm calling them) have to be related to the returned items in the cursor window - eh?

          I thought it was related to a "drawing pane" on the chart (like in other languages).

          I guess that explains it because I wanted to shade the background of a chart without having to populate the cursor window with a bunch of data.

          Maybe this is something esignal can try to achieve in a future version? Having these elements related to the cursor window means we might have to "over populate" the cursor window to achieve desired graphic results.

          BTW, after I ran into these problems, I simply gave up on the graphics portion of the code and developed the required logic for my system.

          Comment


          • #6
            good point. I forgot about that function to control what is shown in the cursor label.

            Either way, I still think it would be great to have "levels of display" (like layers) on the charts that we can draw onto and clear. It would provide a whole new dynamic to efs development.
            Brad Matheny
            eSignal Solution Provider since 2000

            Comment


            • #7
              yeah, but that controls ALL cursor values. So if I want to have 4 items displayed, but have 15 layers on my chart - I can't do it.

              I really want to thank you for your assistance. I'm sure you spent quite a bit of time trying to duplicate my code.

              You may even have found the value of this type of measurement of price by doing so.

              The end result is even though I can't control things like I want, I'm still able to achieve the ultimate goal.

              Thanks again.
              Brad Matheny
              eSignal Solution Provider since 2000

              Comment


              • #8
                Brad

                yeah, but that controls ALL cursor values. So if I want to have 4 items displayed, but have 15 layers on my chart - I can't do it.
                That is not true. setShowCursorLabel() can control the individual labels
                Alex


                Originally posted by Doji3333
                yeah, but that controls ALL cursor values. So if I want to have 4 items displayed, but have 15 layers on my chart - I can't do it.

                I really want to thank you for your assistance. I'm sure you spent quite a bit of time trying to duplicate my code.

                You may even have found the value of this type of measurement of price by doing so.

                The end result is even though I can't control things like I want, I'm still able to achieve the ultimate goal.

                Thanks again.

                Comment

                Working...
                X