 Tweet
Tweet
Hi, I am sure this is something that is really basic but clearly i am missing something as an inexperienced EFS programmer.
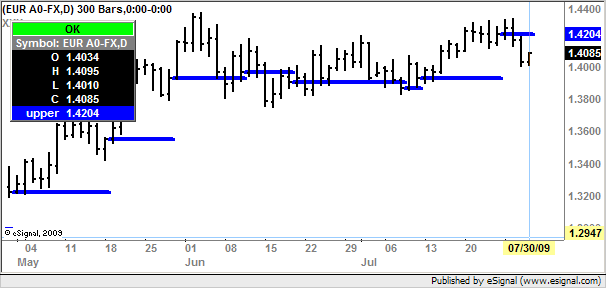
I can get a simple plot onto a chart, But i cannot get it to continue plotting setting the variable to be the same value each bar, until it changes.
I wish it to continue drawing a line, not just a single plot on each occurance.
I have attached some a simple code to illustrate my ignorance!
If anyone can point out the reasons why their help would be much appreciated....thanks.
//TEMPLATE
function preMain() {
setPriceStudy(true);
setStudyTitle("XXX");
setCursorLabelName("upper", 0);
setDefaultBarFgColor(Color.blue, 0);
setDefaultBarThickness(4, 0);
setPlotType(PLOTTYPE_FLATLINES, 0);
}
// Global Variables
var xUpper = null;
var bInit = false;
debugClear
function main() {
//Initialise
if(bInit == false) {
bInit = true;
}
// Validate the study variables to ensure they contain valid data.
if(close(0) == null || close(-1) == null || close(-4) == null || close(-5) == null) {
return; // Exit the formula if variables contain invalid data.
}
if (close(0)>=close(-4) && close(-1)<=close(-5)) {
var xUpper=close(-1);
}
debugPrintln(xUpper);
return xUpper;
}
Comment