Announcement

Collapse
No announcement yet.

Futures Extended Intraday History Problem

Collapse
X
 
  • Filter
  • Time
  • Show
Clear All
new posts

  • Futures Extended Intraday History Problem

    I'm using eSignal 10.5.1678 with Extended Intraday History Subscription.

    There seems to be a serious problem with EFS running on intraday charts and accessing daily data (study or price data) of the previous day.

    For instance, the "Prev High.efs" which comes with eSignal and displays the previous days high on an intraday chart, does not work for days before 06/13/08 with YM 1! (other futures symbols do not work also, but the specific dates, before which this behavior occurs, differ).

    Is there any way to fix this?

    Thanks in advance.
  • #2
    Re: Futures Extended Intraday History Problem

    sculptor66
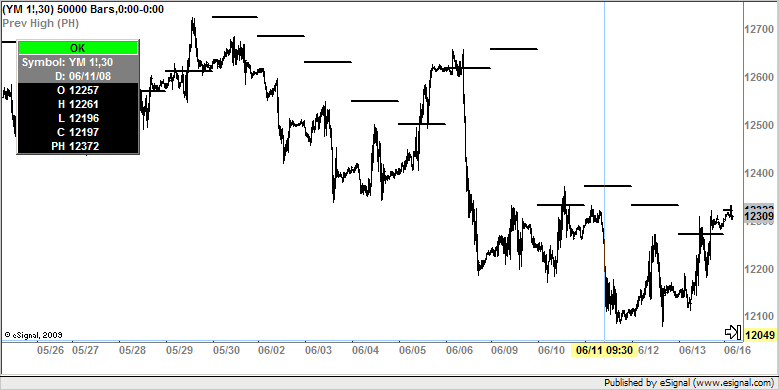
    As far as I can see the script you are referencing is working also on days prior to the date you indicated (see enclosed screenshot)
    You may want to provide some details [preferably including an image] about the Time Template you are using in the chart in which you are running these scripts
    Alex


    Originally posted by sculptor66
    I'm using eSignal 10.5.1678 with Extended Intraday History Subscription.

    There seems to be a serious problem with EFS running on intraday charts and accessing daily data (study or price data) of the previous day.

    For instance, the "Prev High.efs" which comes with eSignal and displays the previous days high on an intraday chart, does not work for days before 06/13/08 with YM 1! (other futures symbols do not work also, but the specific dates, before which this behavior occurs, differ).

    Is there any way to fix this?

    Thanks in advance.

    Comment


    • #3
      Hi Alex,

      thank you for the fast response.

      Please take a look at the attached screenshot. By the way, "Timezone Formating" is set to "Exchange Timezone" (under File > Preferences > Date/ Time Settings).
      Attached Files

      Comment


      • #4
        sculpto66
        The Time Template you are using does not include a definition for the Daily interval which means that this gets set to Dynamic ie it loads whatever number of bars are sufficient to fill in a chart or 300 bars by default [if less were to be required to fill the chart].
        If you open a Daily chart for those symbols [using the same Time Template] and run a simple script to determine the date of the first bar you will see that it will coincide with where the plots of the prevHigh.efs stop on your chart
        The way to resolve this is to create a definition in the Time Template for the Daily interval and set it to load an equivalent [or higher] number of days as you are loading for intraday
        Alex


        Originally posted by sculptor66
        Hi Alex,

        thank you for the fast response.

        Please take a look at the attached screenshot. By the way, "Timezone Formating" is set to "Exchange Timezone" (under File > Preferences > Date/ Time Settings).

        Comment


        • #5
          Thank you Alex.

          I've added a daily interval defintion over 514 days (a few day more than needed, just to be sure)

          Now it works - but only with ES #F, YM #F and so on.

          With ES 1! and YM 1! the problem persists, only that now the script is not working for all dates prior 06/12/09.

          Comment


          • #6
            sculptor66
            As you can see in the image I posted in my previous reply it is working also with the 1! contract at my end.
            Open a daily chart for any one of those symbols, load the same Time Template and see how many days of data you are receiving. Keep in mind that when you call an external symbol and/or interval through efs you are in effect creating a virtual chart for that symbol and/or interval so if something is not behaving as intended or expected you should always create an actual chart to verify what is happening.
            Regardless I don't believe this is an efs issue
            Alex


            Originally posted by sculptor66
            Thank you Alex.

            I've added a daily interval defintion over 514 days (a few day more than needed, just to be sure)

            Now it works - but only with ES #F, YM #F and so on.

            With ES 1! and YM 1! the problem persists, only that now the script is not working for all dates prior 06/12/09.

            Comment


            • #7
              Tried like you suggested.

              Funny thing is, after the daily chart has been loaded, the intraday chart is working also. However, when i load the daily chart, the bars beyond 06/12/09 are appearing step by step. It looks like eSignal ignores the "514 days" setting for the daily template and uses "dynamic" instead.

              This happens with the YM 1!, ES 1!, NQ 1!. No such problem with YM #F and so on. The difference is also clearly visible when loading the daily chart of one of the other instruments. The .. 1! charts appear step by step, the #F charts as a whole, once the data has been loaded.

              Of course, a workaround would be to load the daily chart first, but that's annoying. Any further suggestions?

              Comment


              • #8
                sculptor66
                The slight difference in behavior while the chart loads is due to the fact that the #F contracts are server based [and created as if they were a symbol on their own] while the 1! contracts are desktop based and are created by the application by combining the specific contracts
                That said this does not appear to have an effect on the behavior of efs at my end as it is loading the data as I would expect it to
                Again I don't think this is an efs issue so you may want to contact eSignal's support either directly or through LiveRep as they can better determine where you are connecting to and what the issue may be
                Alex


                Originally posted by sculptor66
                Tried like you suggested.

                Funny thing is, after the daily chart has been loaded, the intraday chart is working also. However, when i load the daily chart, the bars beyond 06/12/09 are appearing step by step. It looks like eSignal ignores the "514 days" setting for the daily template and uses "dynamic" instead.

                This happens with the YM 1!, ES 1!, NQ 1!. No such problem with YM #F and so on. The difference is also clearly visible when loading the daily chart of one of the other instruments. The .. 1! charts appear step by step, the #F charts as a whole, once the data has been loaded.

                Of course, a workaround would be to load the daily chart first, but that's annoying. Any further suggestions?

                Comment

                Working...
                X