Announcement

Collapse
No announcement yet.

Extended intraday data

Collapse
X
 
  • Filter
  • Time
  • Show
Clear All
new posts

  • Extended intraday data

    1. I have extended intraday history enabled.
    2. I have a time template of 1250 days on a basic advanced chart set to 5 minutes. The chart goes back exactly 1250 days and the built in moving averages work.
    3. I loaded the prev open.efs and it only goes back about 300 days.

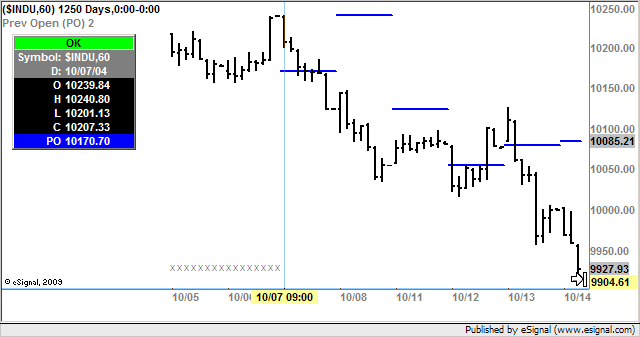
    Below is the code of Formula/OHLC folder/Prev Open.efs with some debug code added. The text "Start" appears under the first bar of the chart and "x" appears under all the bars up until the study starts working.

    Basically it seems that I am only getting 300 days of data for the open(inv("D")) Series Object even though the Time Template is set for 1250 days and the chart goes back 1250 days.


    function preMain() {
    setPriceStudy(true);
    setStudyTitle("Prev Open (PO) 2");
    setCursorLabelName("PO");

    setDefaultBarStyle(PS_SOLID);
    setDefaultBarFgColor(Color.blue);
    setDefaultBarThickness(2);
    setPlotType(PLOTTYPE_FLATLINES);
    }

    var bInit = false;
    var xOpen = null;

    function main() {


    if(isMonthly() || isWeekly() || isDaily())
    return;

    if(bInit == false){

    xOpen = open(inv("D"));
    bInit = true;
    drawText("Start", BottomRow1);
    }

    var vOpen = xOpen.getValue(-1);
    if(vOpen == null){
    drawText("X", BottomRow2);
    return;
    }

    return (vOpen);
    }
    Last edited by twannster; 09-22-2009, 06:26 AM.

  • #2
    Re: Extended intraday data

    twannster
    The script seems to be working fine as you can see in the screenshot enclosed below
    You may want to post an image of the Time Template you are using
    Alex


    Originally posted by twannster
    1. I have extended intraday history enabled.
    2. I have a time template of 1250 days on a basic advanced chart set to 5 minutes. The chart goes back exactly 1250 days and the built in moving averages work.
    3. I loaded the prev open.efs and it only goes back about 300 days.

    Below is the code of Formula/OHLC folder/Prev Open.efs with some debug code added. The text "Start" appears under the first bar of the chart and "x" appears under all the bars up until the study starts working.

    Basically it seems that I am only getting 300 days of data for the open(inv("D")) Series Object even though the Time Template is set for 1250 days and the chart goes back 1250 days.


    function preMain() {
    setPriceStudy(true);
    setStudyTitle("Prev Open (PO) 2");
    setCursorLabelName("PO");

    setDefaultBarStyle(PS_SOLID);
    setDefaultBarFgColor(Color.blue);
    setDefaultBarThickness(2);
    setPlotType(PLOTTYPE_FLATLINES);
    }

    var bInit = false;
    var xOpen = null;

    function main() {


    if(isMonthly() || isWeekly() || isDaily())
    return;

    if(bInit == false){

    xOpen = open(inv("D"));
    bInit = true;
    drawText("Start", BottomRow1);
    }

    var vOpen = xOpen.getValue(-1);
    if(vOpen == null){
    drawText("X", BottomRow2);
    return;
    }

    return (vOpen);
    }

    Comment


    • #3
      Here is a image

      How do I go about posting the image? I took a snapshot of the chart with the Time Template applied and it is saved as prevOpen.png.
      Last edited by twannster; 09-22-2009, 07:00 AM.

      Comment


      • #4
        image attached

        I have attached a png file.

        I am sorry if it is hard to see. Let me know if there is another way to share images.
        Attached Files
        Last edited by twannster; 09-22-2009, 07:10 AM.

        Comment


        • #5
          Time Template image

          Hopefully, I did this right and am attaching an image of the Time Template that I am using (called backtest).

          Please let me know if this is what you wanted.
          Attached Files

          Comment


          • #6
            Re: Time Template image

            twannster
            The Time Template you are using does not include a definition for the Daily interval which means that this gets set to Dynamic ie it loads whatever number of bars are sufficient to fill in a chart or 300 bars by default [if less were to be required to fill the chart].
            If you open a Daily chart for that symbol [using the same Time Template] and run a simple script to determine the date of the first bar you will see that it will coincide with where the plots of your script begin on your chart
            The way to resolve this is to create a definition in the Time Template for the Daily interval and set it to load an equivalent [or higher] number of days as you are loading for intraday
            Alternatively you can use a setIntervalsBackfill() statement in your preMain function (see the link for the description and syntax)
            Alex


            Originally posted by twannster
            Hopefully, I did this right and am attaching an image of the Time Template that I am using (called backtest).

            Please let me know if this is what you wanted.

            Comment


            • #7
              Thank you!

              Thank you very much! I appreciate your expertise. That resolved it.

              Comment


              • #8
                Re: Thank you!

                twannster
                You are most welcome
                Alex


                Originally posted by twannster
                Thank you very much! I appreciate your expertise. That resolved it.

                Comment

                Working...
                X