Announcement

Collapse
No announcement yet.

Indicator overlay

Collapse
X
 
  • Filter
  • Time
  • Show
Clear All
new posts

  • #16
    Hello Greg,

    You probably just need to upgrade to 7.4. To change %K to black, change lines 18 and 19 from:

    PHP Code:
    setDefaultBarFgColor(Color.khaki0);       // %K
    setDefaultBarFgColor(Color.black1);       // %D 
    to:

    PHP Code:
    setDefaultBarFgColor(Color.black0);       // %K
    setDefaultBarFgColor(Color.khaki1);       // %D 
    Jason K.
    Project Manager
    eSignal - an Interactive Data company

    EFS KnowledgeBase
    JavaScript for EFS Video Series
    EFS Beginner Tutorial Series
    EFS Glossary
    Custom EFS Development Policy

    New User Orientation

    Comment


    • #17
      RE: Reply to post 'Indicator overlay'

      Hey Guys, First I would like to thank Jason and RSY for your very much
      appreciated help and time. I'm sorry I have gotten back to you sooner with
      the results but needed to make the comparison to FS first. For the most
      part the Stoch's overlay seems to do what I was looking for as far as pickup
      the divergences between price and Stoch's. We are very close now. But...
      The problem I face now is that the Stoch's now scales to the screen instead
      of price. Meaning if the Stoch's indicator uses the price scale to the
      right of 97800 for the lower range and the upper range 98880 price stays
      compressed to it's own range. There for the price bar range is small. Is
      there a way for the price scale not to see or use the Stoch's overlay for
      the price range? Hope you get my drift!! Also would like to scale Price
      into tenths instead of Hundreds. For instance
      98800, 98810,98820,98830 on the price scale. Is this possible?
      Thanks again,
      Greg

      -----Original Message-----
      From: [email protected] [mailto:[email protected]]
      Sent: Friday, July 25, 2003 5:17 PM
      To: [email protected]
      Subject: Reply to post 'Indicator overlay'

      Hello gsurowiec,

      ~~~~~~~~~~~~~~~~~~~~~~~~~~~~

      Comment


      • #18
        Hello Greg,

        The Stoch and MACD are scaled to the same range in a non-price window. If we were to adjust the Stoch to the price range, you would not have a good visual representation of the study. The MACD would become a flat line at the bottom of the non-price window and the Stoch would be flat lining at the top of the non-price window.

        You can't change the data in the price window to display in tenths, but you could do it with an EFS as a non-price study. You would do something like the following.

        PHP Code:
        function main() {
            var 
        close() * .1;
            return 
        c;

        Jason K.
        Project Manager
        eSignal - an Interactive Data company

        EFS KnowledgeBase
        JavaScript for EFS Video Series
        EFS Beginner Tutorial Series
        EFS Glossary
        Custom EFS Development Policy

        New User Orientation

        Comment


        • #19
          RE: Reply to post 'Indicator overlay'

          Hi Jason, I see what your saying. I ran the Stoch's overlay live today in
          comparison to FS and ES did pretty good with the overlay. I just have to
          keep centering the chart as the day moves along (something I can live with).
          One thing that really bugged me today are the Ma's and Stoch's positions are
          being reflected and highlighted in the price scale. Can this be eliminated?
          I just want price to be highlighted. Also is this the formula below that I
          paste into the editor.

          Thanks,
          Greg

          -----Original Message-----
          From: [email protected] [mailto:[email protected]]
          Sent: Monday, August 04, 2003 4:53 PM
          To: [email protected]
          Subject: Reply to post 'Indicator overlay'

          Hello gsurowiec,

          ~~~~~~~~~~~~~~~~~~~~~~~~~~~~

          Comment


          • #20
            Hello Greg,

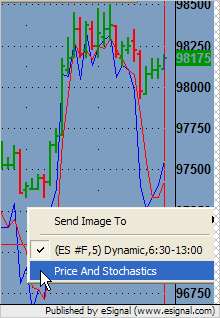
            You can turn off the y-axis labels. Right-click on the y-axis and uncheck the study you want to remove the labels for.


            Yes you can use the code example in a formula, just copy and paste it to the EFS editor and save it.
            Jason K.
            Project Manager
            eSignal - an Interactive Data company

            EFS KnowledgeBase
            JavaScript for EFS Video Series
            EFS Beginner Tutorial Series
            EFS Glossary
            Custom EFS Development Policy

            New User Orientation

            Comment

            Working...
            X