Announcement

Collapse
No announcement yet.

Indicator overlay

Collapse
X
 
  • Filter
  • Time
  • Show
Clear All
new posts

  • Indicator overlay

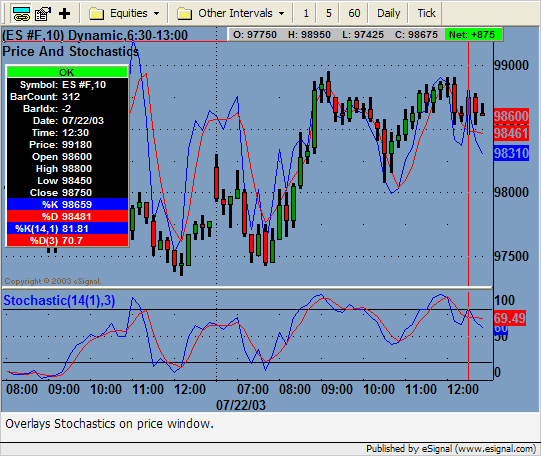
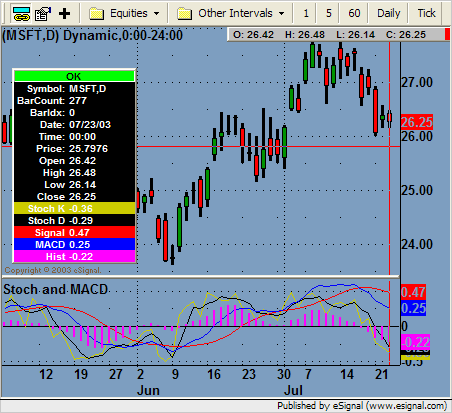
    Hello, I would like to take the Indicator Stoch's %D and overlay it onto the price chart. How do I go about this? Also would like to know how to change the price scale on the righthand side of the chart to a finer measure of price? Instead of a 10 point spread maybe a 5 or 2.5 point spread between price.
    Thanks,
    Greg

  • #2
    gsurowiec,

    I have played around with the %D on the bar chart. The problem I am having is getting the scale to match up with the market on which it is applied. The Stochastic's scale is way different than the Price scale of the market, resulting is a very skewed chart. If anyone knows how to edit the scaling of the Stochastic, this could be done.
    As for your other question on specifying the price scale's precision, this is not really something that can be set. The price scale is just a function of the range of the given market. That is, it is automatically set based on the range of the bars that are currently viewable on the screen. If the range of the bars increases, the scale becomes less precise. However, you can place your mouse cursor in the price scale, hold down the left mouse button, and drag the mouse up and/or down. This will adjust the scale, which you can leave where you'd like it. The only problem with this is that you will be "stretching" or "shrinking" the bars, which may or may not place them in an unreadable position. You'll have to play with that one to get it how you want it. I hope that is helpful.

    Nate McCartney
    Nate McCartney

    Comment


    • #3
      Currently, this type of study is not easy to develop because we do not have the ability to reference two different y-axis to solve this scaling problem. This dual y-axis feature is on our develop team’s list and will be added in a future version. Stay tuned.
      Jason K.
      Project Manager
      eSignal - an Interactive Data company

      EFS KnowledgeBase
      JavaScript for EFS Video Series
      EFS Beginner Tutorial Series
      EFS Glossary
      Custom EFS Development Policy

      New User Orientation

      Comment


      • #4
        RE: Reply to post 'Indicator overlay'

        Hi Jason, Thanks for the reply. Can you give me a time frame as to when
        this is going to get done? I believe if you can put moving averages on a
        chart we shouldn't have to much trouble doing stoch's, Right or wrong? The
        reason I am looking to do this there is a system called the TIMES system
        that uses these parameters. I tried using the stacking of indicators but
        you don't get the proper effect of the indicators. You probably could see
        some more business out of their program which is sponsored on the CBOT
        website. They mention e-signal and the only drawback is not being able to do
        indicator overlay. They have 17 to 30 people take their course a month.
        Anyways please let me know what the status will be on this. Hopefully you
        will be able to do this within a very short time frame and not force me to
        one of your competitors.
        Thanks,
        Greg Surowiec


        -----Original Message-----
        From: [email protected] [mailto:[email protected]]
        Sent: Wednesday, July 16, 2003 9:08 PM
        To: [email protected]
        Subject: Reply to post 'Indicator overlay'

        Hello gsurowiec,

        ~~~~~~~~~~~~~~~~~~~~~~~~~~~~

        Comment


        • #5
          Hello Greg,

          I'm not directly involved the development cycle, so I don't have an exact time frame for you. All I can tell you is that it is in development.
          Jason K.
          Project Manager
          eSignal - an Interactive Data company

          EFS KnowledgeBase
          JavaScript for EFS Video Series
          EFS Beginner Tutorial Series
          EFS Glossary
          Custom EFS Development Policy

          New User Orientation

          Comment


          • #6
            Sorry, bad english, but...

            If it is possible to plot stoch d over the price, and get the scale values of the price chart, it should be possible to calculate new scale values for stock from the scale value on the price study.

            new stock value on price chart =

            ( old stock value / 2 ) * (price scale max - price scale min) + price scale min

            then plot stock with new stock values on price study.

            Am I right?

            RSy

            Comment


            • #7
              RE: Reply to post 'Indicator overlay'

              Hi Jason, Is there a way to get in touch with someone on or with the
              development team? This was also forwarded to me. What do you think, will
              this work?
              Hello gsurowiec,

              ~~~~~~~~~~~~~~~~~~~~~~~~~~~~

              Comment


              • #8
                RE: Reply to post 'Indicator overlay'

                RSY, Thank for the reply in which I have forwarded for his review. They
                tell me it's in the scaling of the indicator that seems to be the problem.
                Thanks again.
                Greg

                -----Original Message-----
                From: [email protected] [mailto:[email protected]]
                Sent: Monday, July 21, 2003 6:22 PM
                To: [email protected]
                Subject: Reply to post 'Indicator overlay'

                Hello gsurowiec,

                ~~~~~~~~~~~~~~~~~~~~~~~~~~~~

                Comment


                • #9
                  Well, I ment:

                  old stock value * ((price scale max - price scale min) / 100) + price scale min

                  RSy

                  Comment


                  • #10
                    If the scaling of normaly stoch works fine, you can calculate new stoch values to plot on the price chart.

                    RSy

                    Comment


                    • #11
                      Hello RSy and Greg,

                      RSy, you're recent conversion formula just might work, but I'll let you be the judge of that. Couple notes on this formula:

                      We don't have access via EFS to the price scale max and min values are of the advanced chart window. So I'm taking the highest high and lowest low over the last 50 bars (nScaleLength) to create a max/min range. You can also edit this range through "Edit Studies." I've also added the input parameters for the Stochastics Study to the formula parameters as well. The defaults are 14 (nKlength), 1 (nKsmooth), and 3 (nDlength).

                      Let me know what you think.

                      PriceAndStoch.efs

                      Jason K.
                      Project Manager
                      eSignal - an Interactive Data company

                      EFS KnowledgeBase
                      JavaScript for EFS Video Series
                      EFS Beginner Tutorial Series
                      EFS Glossary
                      Custom EFS Development Policy

                      New User Orientation

                      Comment


                      • #12
                        Ohm I was just trying to help Greg with an possible way to plot stoch on price....... let Greg be "the jugde"

                        RSy

                        Comment


                        • #13
                          jason - there is a similar problem with indicator overlays if you try to drag 2 indicators into the same subwindow under the price chart. for instance - i would like to use macd and stochcastics but if i put them in the same window you cannot see the macd. when i have done this with other programs the indicators scale independantly and there is not problem overlaying them

                          is there a way to write a multiplier to be applied to the macd scale so it will show up.

                          thanks

                          Comment


                          • #14
                            Hello Sundance86,

                            Try the following. StochAndMACD.efs converts the Stochastics study to match the scale of the MACD study. All inputs for both studies can be configured via "Edit Studies."

                            Jason K.
                            Project Manager
                            eSignal - an Interactive Data company

                            EFS KnowledgeBase
                            JavaScript for EFS Video Series
                            EFS Beginner Tutorial Series
                            EFS Glossary
                            Custom EFS Development Policy

                            New User Orientation

                            Comment


                            • #15
                              RE: Reply to post 'Indicator overlay'

                              Hi Guy's, I just tried to apply the indicator formula that you did for me
                              and I keep getting a Formula Error message. I am doing something wrong?
                              Also Jason, I only need plot % D on the chart. I was going to just color %K
                              black. Thanks for all your help.
                              greg

                              -----Original Message-----
                              From: [email protected] [mailto:[email protected]]
                              Sent: Tuesday, July 22, 2003 5:31 PM
                              To: [email protected]
                              Subject: Reply to post 'Indicator overlay'

                              << File: Reply to post 'Indicator overlay'.txt >> Hello gsurowiec,

                              ~~~~~~~~~~~~~~~~~~~~~~~~~~~~

                              Comment

                              Working...
                              X