 Tweet
Tweet
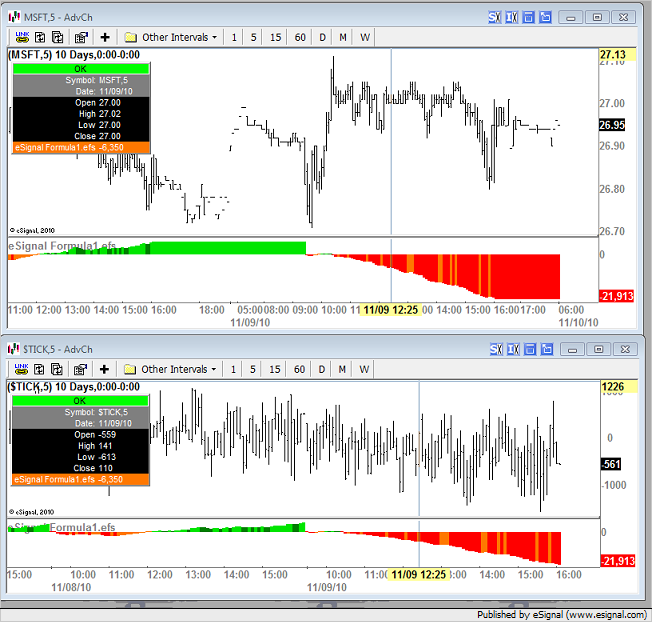
The following code just sums up the tick data since the opening of the market. However, it is not updating automatically through out the day. I have to refresh to update. What am I doing wrong?
PHP Code:
var fpArray = new Array();


function preMain() {

    setPriceStudy(false);

    setStudyTitle("Cumul Tick Interday");


    setDefaultBarStyle(PS_SOLID, 0);

    setDefaultBarStyle(PS_SOLID, 1);

    setDefaultBarStyle(PS_SOLID, 2);

    setDefaultBarStyle(PS_SOLID, 3);


    setDefaultBarFgColor(Color.black, 1);

    setDefaultBarFgColor(Color.red, 2);

    setDefaultBarFgColor(Color.blue, 3);


    setDefaultBarThickness(4, 0);

    setDefaultBarThickness(1, 1);

    setDefaultBarThickness(2, 2);

    setDefaultBarThickness(2, 3);


    setPlotType(PLOTTYPE_HISTOGRAM, 0);

    setPlotType(PLOTTYPE_LINE, 1);

    setPlotType(PLOTTYPE_LINE, 2);

    setPlotType(PLOTTYPE_LINE, 3);


    setShowCursorLabel(false, 1);

    setShowCursorLabel(false, 2);

    setShowCursorLabel(false, 3);


    addBand(5000, PS_SOLID, 1, Color.black, "a");

    addBand(-5000, PS_SOLID, 1, Color.black, "b");


    var x=0;

    fpArray[x] = new FunctionParameter("nSym", FunctionParameter.STRING);

    with(fpArray[x++]){

        addOption("$TICK");

        addOption("$TICKQ");

        setDefault("$TICK");

    }


}

var vSum = 0;

var vSum0 = 0;

var vSum1 = 0;

var myColor = Color.fushcia;

var myPrevColor = Color.blue;

var bInit = false;


function main(nSym) {


    setCursorLabelName(nSym, 0);


    if (getBarState()==BARSTATE_NEWBAR){

        vSum1 = vSum;

        myPrevColor = myColor;

        bInit = false;

    }


    vSum = efsInternal("aSum", nSym);

    vSum0 = vSum;


    if (vSum > vSum1 && vSum > 0){

        myColor = Color.RGB(0,230,0);

        setDefaultBarFgColor(myColor);

    }

        else if (vSum <= vSum1 && vSum > 0){

        myColor = Color.green;

        setDefaultBarFgColor(myColor);

    }

        else if (vSum > vSum1 && vSum < 0){

        myColor = Color.RGB(255,120,0);

        setDefaultBarFgColor(myColor);

    }

        else if (vSum <= vSum1 && vSum < 0){

        myColor = Color.red;

        setDefaultBarFgColor(myColor);

    }

    else{

        myColor = myPrevColor;

        setDefaultBarFgColor(myColor);

    }


    return new Array(vSum,vSum0);


}


function aSum(nSym){


    if (getBarState()==BARSTATE_NEWBAR){

        var nSum = 0.0;

    }


    var vTime = getValue("Time");

    var vFirstIndex = getFirstBarIndexOfDay(vTime, nSym);

    if (vFirstIndex == null && getDay(0) == getDay(-1)) {

        return;

    }


    var vValue = getValue("Close", 0, vFirstIndex, nSym);

    if(vValue == null) {

        return;

    }


    for(i = 0; i < -vFirstIndex + getCurrentBarIndex(); i++) {

        nSum += vValue[i];

    }


    return (nSum);

}
Comment