Announcement

Collapse
No announcement yet.

Problem with NEWBAR and nested indicators

Collapse
X
 
  • Filter
  • Time
  • Show
Clear All
new posts

  • Problem with NEWBAR and nested indicators

    When the efs engine calculates rsi(10, atr(5)), or similar.
    All is fine under computeOnClose() or running normally.
    However, I want to create a custom nested indicator using
    efsInternal so cannot use computeOnClose() and as I do not
    want to overload my cpu every tick I wanted to use GetBarState()
    and only calculate on a NEWBAR.
    The problem is that this barState method produces erratic results
    which I just cannot get to the bottom of. I am fairly confident
    that the logic is correct but if after loading two examples of
    the nested indicator and leaving them for several bars, I then
    'reload' one of them, it redraws a line which is substantially
    different from the other copy. More importantly any further
    calculations are erroneous. I've been struggling with this for a
    while now and this simple example is the distillation from much
    more complex indicators all of which are erratic!

    PHP Code:
    var newInd 0;

    function 
    main(){
     
    var 
    vState getBarState();

    if (
    vState == BARSTATE_NEWBAR){
        
          
    newInd   rsi(10atr(5));

    } else {

          return 
    newInd;  
     
    }
     
    //do more calculations at NEWBAR

          
    return newInd


  • #2
    eSignal functions return a series. You create the series only once and then retrieve individual values as needed. An example of this is:
    PHP Code:
    var bInit=false;
    var 
    newInd 0;
    function 
    main(){
        if(!
    bInit){
            
    newInd getSeries(rsi(10atr(5));
            
    bInit=true;
        }
        
    //the series is now created so you can place calculations within the vState routine to run on every new bar.

    An alternative is to do a null check so once the series is created it is not recreated.

    PHP Code:
    var newInd null;
    function 
    main(){
        if(
    newInd == nullnewInd getSeries(rsi(10atr(5));
        
    //now run code within the vState routine.

    Wayne
    Last edited by waynecd; 12-27-2012, 12:08 PM.

    Comment


    • #3
      Thanks Wayne...
      Checking back through my code I realise I normally do as you suggest but I had 'gone off track'
      when trying to debug the efsInternal/computeOnClose() conflict problem I ran into. It was that
      oversight on my part which ran me into difficulty... thanks again.

      Regards
      Nigel
      Last edited by red49er; 12-28-2012, 11:15 PM.

      Comment


      • #4
        Yw,

        I would guess that most of us get sidetracked during debug tests.

        Regards,

        Wayne
        Last edited by waynecd; 12-30-2012, 02:40 PM.

        Comment


        • #5
          Followup to NEWBAR

          Hi Wayne if you are still there,

          I should have asked this question when I last posted in my other thread about newbar.
          What is the difference between

          newInd = getSeries(rsi(10, atr(5));
          and
          newInd = (rsi(10, atr(5));
          They both produce identical results?

          Nigel

          Comment


          • #6
            Try the following code:
            PHP Code:
            var bInit=false
            var 
            newInd 0
            function 
            preMain(){ 
                
            setPriceStudy(false); 

            function 
            main(){ 
                var 
            newInd_0;
                if(!
            bInit){ 
                    
            newInd getSeries(rsi(10atr(5))); 
                    
            bInit=true
                } 
                
            //the series is now created so you can place calculations within the vState routine to run on every new bar.
                
            newInd_0 newInd.getValue(0);//retrieves individual values from the series, in this case the value for the most current bar
                //debugPrintln("newInd_0: "+newInd_0);
                 
            return newInd

            It doesn't plot since it just returns the object type and not the series of values.
            Now try:
            PHP Code:
            var bInit=false;
            var 
            newInd 0;
            function 
            preMain(){
                
            setPriceStudy(false);
            }
            function 
            main(){
                if(!
            bInit){
                    
            newInd getSeries(rsi(10atr(5)));
                    
            bInit=true;
                }
                
            //the series is now created so you can place calculations within the vState routine to run on every new bar.
                
            return newInd;

            It plots correctly.
            Alternatively try:
            PHP Code:
            var bInit=false;
            var 
            newInd 0;
            function 
            preMain(){
                
            setPriceStudy(false);
            }
            function 
            main(){
                if(!
            bInit){
                    
            newInd getSeries(rsi(10atr(5)));
                    
            bInit=true;
                }
                
            //the series is now created so you can place calculations within the vState routine to run on every new bar.
                
            return getSeries(newInd);

            It plots exactly like the previous code but in my opinion it is slightly less efficient.
            Again, alternatively try:
            PHP Code:
            var bInit=false;
            var 
            newInd 0;
            function 
            preMain(){
                
            setPriceStudy(false);
            }
            function 
            main(){
                if(!
            bInit){
                    
            newInd rsi(10atr(5));
                    
            bInit=true;
                }
                
            //the series is now created so you can place calculations within the vState routine to run on every new bar.
                
            return newInd.getValue(0);

            Again it plots correctly.

            Do a search for "getSeries" in the efsKnowledgeBase for further info.
            As I understand it and in general terms getSeries retrieves and assigns the series to a variable for plotting in the return statement. Without it you get back the type "series object" and not the actual series of values. You can always retrive individual values from the series object without using the "getSeries" function by using the "x.getValue(...)".

            Wayne
            Last edited by waynecd; 12-31-2012, 05:40 AM.

            Comment


            • #7
              I am still uncertain as to why you used 'getSeries' in front of a nest of library indicators,
              as none of the examples in the help files that I researched have it.
              As I understand it 'getSeries' is used to convert the individually calculated values in an array
              such as (close(0)-close(n)), into a series object so that it may be used inside the nest and be acted
              upon by a library indicator. In this instance the whole nest would have to be part of an 'efsInternal'
              statement.
              So I go back to my original question, why use 'getSeries'?
              The following snippet has been running all day without the use of 'getValue(0)' and with no difference between plots.
              Also debugPrint() returns the individual values which are ploted.


              PHP Code:
              function preMain(){
              setDefaultBarFgColor(Color.red0);

              }
              function 
              main(){
              newInd1 getSeries(rsi(10atr(5)));

              newInd2 rsi(10atr(5))+4;    //to separate plots I added 4

              return new Array(newInd1newInd2);

              I know this is all beginning to sound a bit picky but I am still genuinely lacking full understanding
              of these issues!

              Regards
              Nigel
              Last edited by red49er; 12-31-2012, 10:09 AM.

              Comment


              • #8
                In the first example in my last post I intended to demonstrate how NOT using getSeries results in no plot but I inadvertently used getSeries. The example should be:
                PHP Code:
                var bInit=false
                var 
                newInd 0
                function 
                preMain(){ 
                    
                setPriceStudy(false); 

                function 
                main(){ 
                    var 
                newInd_0;
                    if(!
                bInit){ 
                        
                newInd rsi(10atr(5)); 
                        
                bInit=true
                    } 
                    
                //the series is now created so you can place calculations within the vState routine to run on every new bar.
                    
                newInd_0 newInd.getValue(0);//retrieves individual values from the series, in this case the value for the most current bar
                    //debugPrintln("newInd_0: "+newInd_0);
                     
                return newInd;  //doesn't plot
                    // return newInd_0; //plots fine

                or
                PHP Code:
                var newInd
                function 
                preMain(){ 
                    
                setPriceStudy(false); 

                function 
                main(){ 
                    var 
                newInd_0;
                    if(
                newInd == nullnewInd rsi(10atr(5)); 
                    
                newInd_0 newInd.getValue(0);//retrieves individual values from the series, in this case the value for the most current bar
                    //debugPrintln("newInd_0: "+newInd_0);
                     
                return newInd//doesn't plot
                     //return newInd_0; //plots fine

                These examples don't plot unless "newInd_0" is returned instead of "newInd".

                However if you don't do a null check or frame it within a conditional like bInit it returns a plot since the series is recreated on every tick (very inefficient) and not just once as in your example and this next script:
                PHP Code:
                var newInd
                function 
                preMain(){ 
                    
                setPriceStudy(false); 

                function 
                main(){ 
                    var 
                newInd_0;
                    
                newInd rsi(10atr(5)); 
                     return 
                newInd;

                In this next example the return value is "NaN" because as I understand it it returns the object itself and not a value or series of values:
                PHP Code:
                var bInit=false
                var 
                newInd
                function 
                preMain(){ 
                    
                setPriceStudy(false); 

                function 
                main(){ 
                    var 
                newInd_0;
                    if(
                newInd == null){
                        
                newInd rsi(10atr(5)); 
                    }
                    if(
                newInd!=nulldebugPrintln("25: "+newInd); //outputs "25: NaN"
                     
                return newInd

                The reason I use getSeries inside the bInit conditional instead of as part of the return statement is, as I explained, I find it to be more efficient (in tests using the "Performance Monitor" in eSignal ver 10.6).

                I know this is all beginning to sound a bit picky but I am still genuinely lacking full understanding
                of these issues!
                Mostly I draw my conclusions via tests and trial and error. Other than that you will have to ask tech support or one of the gurus in the forum.

                Regards,
                Wayne
                Last edited by waynecd; 12-31-2012, 01:31 PM.

                Comment


                • #9
                  Okay Wayne, thank you for that. I also endeavour to draw my conclusions via trial and error, but occasionally have to ask tech support or one of the gurus in the forum for direction.
                  You are obviously my guru in this instance and I finally understand why some of my indicators have been working using, for instance:
                  newInd = rsi(10);
                  return newInd;
                  or even
                  return (rsi(10));

                  I had not realised the reason it calculated a plotable 'value' was because the series was being recreated on every pass, this 'value' calculation is obviously an AUTOMATIC feature of the efs engine. Where as, if the series is created only once initially further values have to be extracted from the series using getValue(0). Of course the later code, as you say, is far more efficient.
                  Unfortunately, I'm not even certain that this point is made clear in the help files, although they do mention that some of the examples are to demonstrate functionality not necessarily efficiency.

                  Thanks also for the insight into the efs engine efficiency of using 'getSeries'.

                  However, none of the above addresses the real issue which I found to be a problem and the reason I started this thread.
                  Perhaps you would be good enough to run two examples of the following code on a forex 1min chart, that way you'll see what I'm talking about more quickly. After a few minutes reload one of the two and compare the differences, you will find the chart outputs are different. The current bar values differ but then snap back into sync when the next new bar is calculated. I've put a visual color alert on to illustrate further.
                  Both v10.6 and v11 return the same values that plot and debugPrint, but the values within the code, after the new bar filter do not seem to be the same and do not trigger the ensuing logic...
                  This happens only when I use a NEWBAR filter, and I have absolutely no idea why!! I've tried to get round it by constructing nested indicators using arrays as per EFS1, but even these are affected by the NEWBAR filter.

                  PHP Code:
                  function preMain(){
                      
                  setStudyMax(100);
                      
                  setStudyMin(0);
                  }

                  var 
                  bInit false
                  var 
                  xNewInd null;
                  var 
                  newInd_0 0;
                  var 
                  newInd_1 0;

                  function 
                  main(){
                   
                      if(!
                  bInit){ 
                          
                  xNewInd getSeries(rsi(10atr(5)));
                          
                  bInit true
                      } 

                      var 
                  vState getBarState();
                      if(
                  vState == BARSTATE_NEWBAR){
                          
                  newInd_0 xNewInd.getValue(0);
                          
                  newInd_1 newInd_0;
                      }else{
                          
                  debugPrintln("OLDBAR: "+newInd_1);
                          return 
                  newInd_1;
                      }
                      
                  //do further calcs at new bar
                      
                  debugPrintln("==============");
                      
                  debugPrintln("NEWBAR: "+newInd_0);
                      
                  debugPrintln("==============");
                      
                      if(
                  newInd_0 65setBarBgColor(Color.cyan,    010085);
                      if(
                  newInd_0 45setBarBgColor(Color.magenta0,   015);
                      
                    return 
                  newInd_0

                  Check it for yourself.

                  Regards
                  Nigel
                  Last edited by red49er; 01-02-2013, 02:33 AM.

                  Comment


                  • #10
                    After a few minutes reload one of the two and compare the differences, you will find the chart outputs are different. The current bar values differ but then snap back into sync when the next new bar is calculated. I've put a visual color alert on to illustrate further.
                    I can duplicate what you see even with a rewrite of the code (see below) and a couple of other tests. The return value for the reloaded (2d instance of the script) is different than that of the 1st instance only for the bar executing at the time of the reload.

                    I don't know why it does that nor do I have a solution. Maybe tech support or another forum member might know.

                    Consider sending it in as a bug to tech spt.
                    PHP Code:
                    var bInit false;  
                    var 
                    xNewInd null
                    var 
                    newInd_1 0//retains the last value 

                    function main(){ 
                        var 
                    newInd_0 0//resets the value every tick.  You don't want it as a global variable
                        
                    if(!bInit){  
                            
                    xNewInd getSeries(rsi(10atr(5))); 
                            
                    bInit true;  
                        }  
                        
                    newInd_0 xNewInd.getValue(0); //this retrieve the value every tick and is needed on every tick so that the retu

                        
                    var vState getBarState(); 
                        if(
                    vState == BARSTATE_NEWBAR){ 
                            
                    newInd_1 newInd_0//this now records and holds the "newInd_0" value until the next bar
                        
                    }
                        
                    //below I changed every instance of "newInd_0" to "newInd_1" so only the value of the 1st tick of the last new bar is recorded
                        
                    if(newInd_1 65setBarBgColor(Color.cyan,    010085); 
                        if(
                    newInd_1 45setBarBgColor(Color.magenta0,   015); 
                         
                        return 
                    newInd_1;  

                    Wayne
                    Last edited by waynecd; 01-02-2013, 02:13 PM.

                    Comment


                    • #11
                      OK Wayne thanks, I'll try tech support.

                      Comment


                      • #12
                        Nigel
                        The issue you are having is not due to nested indicators, arrays, series objects, their initialization, etc or a bug as waynecd implies but is one of simple logic
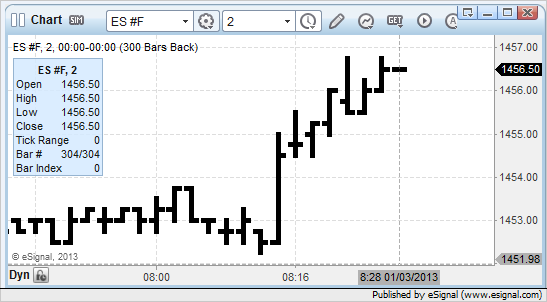
                        You are retrieving [and subsequently storing] the value of the indicator as it is calculated on the first tick of each new bar. In real time each of these bars is incomplete at that instant [with some exceptions]. In the following image you can see that on the first tick the OHLC values are all the same


                        When you then reload the efs it iterates through those same bars which are completed at this point and whose HLC values are likely different than when those bars were first created (the O remains constant throughout the life of the bar).


                        Hence any study that is based on any one of these HLC values is going to return different results in this instance
                        If you want the last completed values at the new bar you should retrieve those of the previous bar not the ones for the current bar
                        Alex


                        Originally posted by red49er View Post
                        <SNIP> However, none of the above addresses the real issue which I found to be a problem and the reason I started this thread.
                        Perhaps you would be good enough to run two examples of the following code on a forex 1min chart, that way you'll see what I'm talking about more quickly. After a few minutes reload one of the two and compare the differences, you will find the chart outputs are different. The current bar values differ but then snap back into sync when the next new bar is calculated. I've put a visual color alert on to illustrate further.
                        Both v10.6 and v11 return the same values that plot and debugPrint, but the values within the code, after the new bar filter do not seem to be the same and do not trigger the ensuing logic...
                        This happens only when I use a NEWBAR filter, and I have absolutely no idea why!! I've tried to get round it by constructing nested indicators using arrays as per EFS1, but even these are affected by the NEWBAR filter.

                        PHP Code:
                        function preMain(){
                            
                        setStudyMax(100);
                            
                        setStudyMin(0);
                        }

                        var 
                        bInit false
                        var 
                        xNewInd null;
                        var 
                        newInd_0 0;
                        var 
                        newInd_1 0;

                        function 
                        main(){

                            if(!
                        bInit){ 
                                
                        xNewInd getSeries(rsi(10atr(5)));
                                
                        bInit true
                            } 

                            var 
                        vState getBarState();
                            if(
                        vState == BARSTATE_NEWBAR){
                                
                        newInd_0 xNewInd.getValue(0);
                                
                        newInd_1 newInd_0;
                            }else{
                                
                        debugPrintln("OLDBAR: "+newInd_1);
                                return 
                        newInd_1;
                            }
                            
                        //do further calcs at new bar
                            
                        debugPrintln("==============");
                            
                        debugPrintln("NEWBAR: "+newInd_0);
                            
                        debugPrintln("==============");
                            
                            if(
                        newInd_0 65setBarBgColor(Color.cyan,    010085);
                            if(
                        newInd_0 45setBarBgColor(Color.magenta0,   015);
                            
                          return 
                        newInd_0

                        Check it for yourself.

                        Regards
                        Nigel

                        Comment


                        • #13
                          Alex,

                          Thank you for resolving the issue for me, it all seemed so obvious after you explained.
                          I am familiar with the same principle when accessing data from higher time intervals and so should
                          have realised that the bar was still building!
                          However, a couple of points that are still unclear to me;

                          1) It seems that the efs engine makes an efsInternal routine scan its functions
                          every tick, BYPASSING a NEWBAR filter, I presume this is to collect and store the relevant
                          data ready for the next bar calculation, and why computeOnClose() cannot be used?

                          2) What is the difference between getSeries(x) and getSeries.x and where can I read further about
                          'getSeries' as I am still confused as to its correct usage. Do you agree with Wynecd about the extra
                          efficiency of getSeries and advocate its use in the instances mentioned?

                          Regards
                          Nigel

                          Comment

                          Working...
                          X