Announcement

Collapse
No announcement yet.

getCurrentBarIndex() return wrong bar index !!!

Collapse
X
 
  • Filter
  • Time
  • Show
Clear All
new posts

  • getCurrentBarIndex() return wrong bar index !!!

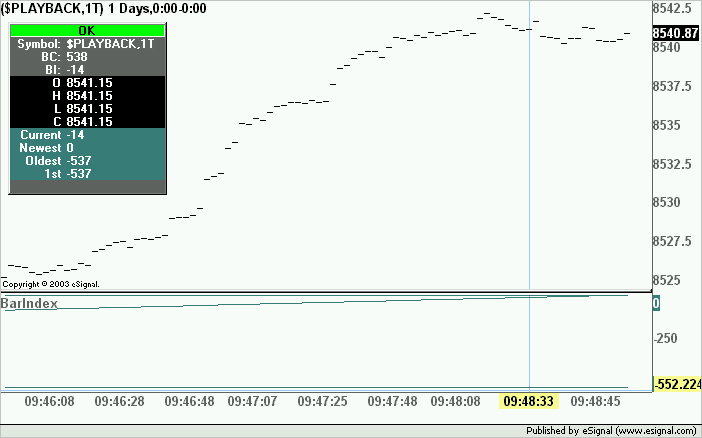
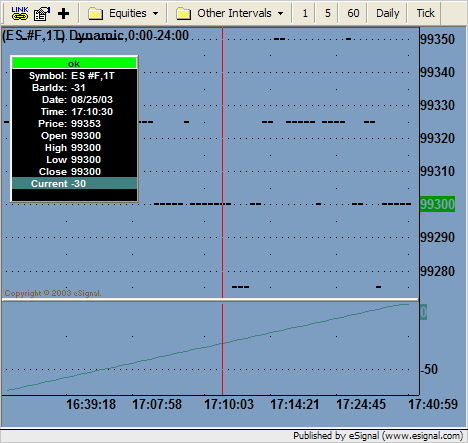
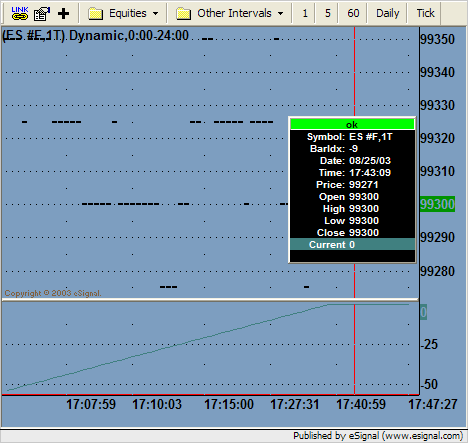
    I have noticed that the function getCurrentBarIndex() returns bar index the same as getNewestBarIndex() , which is 0, for dynamic tick charting. So this is not correct current bar index. For example, a bar - which is 10 bars from the newest bar (the bar on the right edge of the chart) - should have the current bar index of -10. The getCurrentBarIndex() returns 0 !!!!. My plots on tick chart therefore have been all distorted !!!

    However, for static charting (no coming tick data), getCurrentBarIndex() returns correct bar indices after reloading the efs. And the appearance of the plots now are as expected.

    Dzung Nguyen

  • #2
    Hello Dzung,

    When your formula is executing on the current bar (right most bar) and you call getCurrentBarIndex(), you will always get 0. The bar that is 10 bars old, will always have a bar index of -9. At the instance a new bar arrives, all the historical bar indexes are updated to reflect their current position relative to the newest bar, which is always 0. When you first apply a formula, it starts computing on the oldest bar first and will compute once for each historical bar. If your chart loads 100 bars, getCurrentBarIndex() will return -99 on the oldest bar, then -98 on the next bar, etc. etc. all the way to 0. In real time going forward getCurrentBarIndex() will always return 0 on the most current bar. Does this help you better understand how the bar indexing works?
    Jason K.
    Project Manager
    eSignal - an Interactive Data company

    EFS KnowledgeBase
    JavaScript for EFS Video Series
    EFS Beginner Tutorial Series
    EFS Glossary
    Custom EFS Development Policy

    New User Orientation

    Comment


    • #3
      Hi Jason

      Thanks for your explaination. I think I already understood how the bar indexing. The CurrentBarIndex = NewestBarIndex = 0 for ONLY the right most bar, as you say. For other bars, the NewestIndex is still 0, but the CurrentBarIndex should be -1, -2, -3, ... for bar 1, 2, 3, .., bars away from the right most bar, as you say. However, with tick chart, I have noticed that CurrentBarIndex = NewestBarIndex = 0 also for other bars (i.e. 1, 2, 3, ...,10, ... bars away from the right most bar.

      I attach an efs which returns indices so you can run on a tick (or 1T) chart with 2 cases :

      1) tick replay
      2) real time

      and then see what I meant.

      Regards
      Dzung Nguyen
      Attached Files

      Comment


      • #4
        It would appear that Current Index is giving the correct value on a 1T Tick Replay chart. In fact it matches the value of the BI (Bar Index) native to the Cursor Window as does the BC (Bar Count) which is 538 ie equal to Oldest (-537) plus Newest (0)
        Alex

        Comment


        • #5
          Hi Jason

          This is a tick replay of AMZN 0f 08/25/03 6:30-13:00 (trades only). I attach to the chart Close[1].efs to plot the tick price and ndBarIndex.efs to plot indices. I ran the tick replay for 89 ticks, then pause, and reload both efs. The attached chart shows that after reloading efs, the tick prices (magenta) returned by Close[1].efs match the prices 9black) plotted by the chart. The indices returned by ndBarIndex.efs are all correct.

          to be continued ...

          Dzung Nguyen
          Attached Files

          Comment


          • #6
            Hello Dzung,

            getCurrentBarIndex() works the same way with a 1T interval as well. Let's look at your formula displaying only "Current." Change your return line to:

            return Current;


            When we first apply the formula, the formula starts at the oldest bar and returns something like -42,000. The formula iterates from left to right until it reaches the most current bar, or bar 0. If we plot the return of Current, you get the following line.


            Now, in real time, as new bars (or ticks) arrive, the bar indexes of the chart update to reflect their current position relative to bar 0. The line that we are returning to the chart, which is the result of getCurrentBarIndex() does not update the historical values of the line to match the bar indexes of the chart. This is the difference you are seeing after several new bars arrive. The chart below shows what happens to the line. In real time, the formula is only executing on the current bar and returns 0 for getCurrentBarIndex(), thus we get a flat line at 0 from the time we first applied the formula. If you look at the bar index field in the cursor window, you will see that the index of the bar 10 bars ago has updated to show it's correct bar index of -9. Our return line still reflects 0 because at the time that our formula executed on that bar it was the most current bar in the chart.


            If you reload the formula at this point, the line will update to match the current bar index values. Perhaps you could tell me more about what you are trying to accomplish in the formula you are working on and I'll help you create the code solution you need.
            Jason K.
            Project Manager
            eSignal - an Interactive Data company

            EFS KnowledgeBase
            JavaScript for EFS Video Series
            EFS Beginner Tutorial Series
            EFS Glossary
            Custom EFS Development Policy

            New User Orientation

            Comment


            • #7
              Hi Jason

              However, after I tick replayed for another 20 ticks. The chart looks like this. Now you can see that the tick prices (magenta) by Close[1].efs are far behind the prices (black) by the chart. And the CurrentBarIndices of 7 bars next to the right most bar are all 0, not -1, -2, -3, ..., -7 as expected.

              Regards
              Dzung Nguyen
              Attached Files

              Comment


              • #8
                Hi Alex

                I guess that if you continue with the replay, the chart would get to the point where Current is no longer the same as BI shown in the Cursor fileld. I already illustrated it in my previously attached charts; Jason also showed this effect in his chart examples.

                Hi Jason

                So, your chart examples confirmed my point that in dynamic (or forward) charting getCurrentBarIndex() always returns 0 to the right most bar (bar 0), and that 0 value unchanged when the bar becomes historical (i.e. moves to the right). One way to make getCurrentBarIndex() returns the correct current bar index is to manually reload the efs. I have tried to use reloadEFS() to reload my efs automatically without success. And Jay said that reloadEFS() should not be used because it can lead to infinite looping and crash.

                So in dynamic charting, the problem is any plotting, which relies on getCurrentBarIndex() to get the current bar index, would be distorted. An example is the ZigZag[1].efs

                Another related problem is two functions close() and volume() don't seem to return the same values of close and volume that plotted by tick chart and returned by the Basic Studies - Volume . The attach chart illustrates this point.

                The magenta volume plot is generated by volume.efs given in Library folder. This efs uses volume() to returns volume values. The blue volume plot is generated by Basic Studies - Volume. Why the magenta volume lags the blue one ? Is it due to the problem with the Current Bar Index or something else ?

                The plots of tick price also confirm the above problems. Note that the magenta price plot is generated by Close.efs (which returns close()), while the black tick price is given by the tick chart. Besides the problem of lagging behind, the magenta price plot is quite different from the black tick chart. Some important prices (e.g. 44.82 @ BI of -5, 44.705 @ BI of -12) of the black plot are not shown on the magenta plot. To me this is a serious problem, because close() doesn't seem to return all tick prices, somehow it skips quite a number of tick prices !!!

                Dzung Nguyen
                Attached Files

                Comment


                • #9
                  Hello Dzung,

                  There is a known problem with EFS formulas running on a tick chart of a fast moving market. Our development team is aware of this and will be looking into a solution. To get a better execution with your formula use an interval like 20T or 50T.

                  The problem you are seeing has nothing to do with getCurrentBarIndex(), it executes properly. You are just expecting a line that you are returning to the chart to update the historical values of the line when a new bar arrives. An EFS formula that charts the return of getCurrentBarIndex() does not have any built-in routine that will go back and change the historical values of that line. The actual bar indexes, as you can see in the cursor window, do update every time a new bar arrives. After a formula has been applied to your chart, it only executes on the current bar, or bar 0. Any values returned to the chart while the formula was loading will remain on the chart and will not get changed once they become historical. In the case of getCurrentBarIndex(), when the formula is loading is starts at the oldest bar first, which does not have a bar index of 0, thus it plots its current bar index value like -923 etc. Once the formula is completely loaded, it only executes on bar 0. Consider a moving average for example. When the formula is executing on the current bar, or bar 0, it will return some value to the chart like 85.75. After ten new bars arrive that 85.75, which is now on bar index -9, will still be 85.75. A formula that is computing on bar 0 and returns the result of getCurrentBarIndex(), will return a 0 value. After ten new bars arrive that 0 value will still be 0 at bar -9. Keep in mind that is only for the line you are returning to the chart. The actual bar indexes do update historically as you can see in the cursor window. The getCurrentBarIndex() function has no affect on the historical bars’ values. I hope this clears up any confusion you have about this function.
                  Jason K.
                  Project Manager
                  eSignal - an Interactive Data company

                  EFS KnowledgeBase
                  JavaScript for EFS Video Series
                  EFS Beginner Tutorial Series
                  EFS Glossary
                  Custom EFS Development Policy

                  New User Orientation

                  Comment


                  • #10
                    Hi Jason

                    I'll get back to the problem with getCurrentBarIndex() in plots using drawLineRelative() later.

                    Now, I still don't understand why the magenta volume plot (using volume() to return volume values) lags the blue volume plot (Basic Studies - Volume). As you said, this lagging has nothing to do with Current bar indexing, and I agree. Then is it because volume() doesn't return all tick volume values ? If so, which function the Basic Studies - Volume uses to return accurate and complete tick volume values. Can you please share that function with me and other users ?

                    Dzung

                    Comment


                    • #11
                      Hello Dzung,

                      getMostRecentTradeSize() should work for you. Give that a try.
                      Jason K.
                      Project Manager
                      eSignal - an Interactive Data company

                      EFS KnowledgeBase
                      JavaScript for EFS Video Series
                      EFS Beginner Tutorial Series
                      EFS Glossary
                      Custom EFS Development Policy

                      New User Orientation

                      Comment


                      • #12
                        Hi Jason

                        Thanks for that.

                        getMostRecentTradeSize() works fine in real time, its volume values are identical to those returned by Basic Sudies - Volume.
                        However, in tick replay, getMostRecentTradeSize() returns -1 always. I guess that this function is for real time only, not for historical data or for replay mode. if so, is there an equivalent function for tick replay (i.e. to get tick volume values tick by tick in replay mode) ?

                        Another thing is that is there a function called getMostRecentTradePrice() or getMostRecentTradeClose() so that I can get tick prices in real time ?

                        Dzung

                        Comment


                        • #13
                          Hello Dzung,

                          Correct, getMostRecentTradeSize() will only work in real time.

                          volume() and close() are the functions you need. Try this:

                          PHP Code:
                              var vSym getSymbol() + ",T";
                              var 
                          volume(01vSym)*1;
                              if (
                          == null) return;
                              
                          //debugPrintln(v);
                              
                          return v
                          But remember, you will have problems running EFS formulas on a 1T interval on fast market, in tick play back or real time. Try using a different interval like 50T for fast markets.
                          Jason K.
                          Project Manager
                          eSignal - an Interactive Data company

                          EFS KnowledgeBase
                          JavaScript for EFS Video Series
                          EFS Beginner Tutorial Series
                          EFS Glossary
                          Custom EFS Development Policy

                          New User Orientation

                          Comment


                          • #14
                            Hi Jason

                            Thanks for the coding.

                            Based on what you have suggested regarding returning volume values. I did a little research and want to share with you and other users. On 1T (1 tick) chart I have found that the following functions return volume values (vV) identical to those returned by the Basic Sudies - Volume (BSV) during tick replay:

                            1- getValue("volume", 0, -n, "sym,1T") [an array of n elements, use the 1st element of array]
                            2- getValue("volume", 0, 1, "sym,1T")
                            3- volume(0,1, "sym,1T")
                            4- volume()

                            where sym is symbol (e.g. AMZN, $PLAYBACK, $INDU, ...)

                            However, on the T (no # 1 infront) chart, none of the above functions returned matching vV to BSV's regardless "sym,T "or "sym,1T".

                            I did try similar tests for close values (vC), by replacing volume with close in the above 4 functions. None works !!! Have to wait until eSignal Develoment Team fix this bug, I guess. In my opinion, it's is in the plotting routines, somewhere, due to not coping with fast streaming data in fast market (as you mentioned). The bug is not in the value accessing routines/functions.

                            I'll getback to the getCurrentBarIndex() issue next time.

                            Dzung
                            Last edited by dungn6au47; 08-27-2003, 09:52 AM.

                            Comment


                            • #15
                              Hi Jason, Jay and all

                              Now, I just have time to get back to the getCurrentBarIndex() issue.

                              Attached is a chart using ZigZag[1].efs (ZZ) - downloaded from File Sharing, TSSupport - to plot price swing. The ZZ was reloaded at BarCount 631, and ZZ identified peaks and troughs of the bar price chart correctly. However, ZZ lags the price chart as the replay continues, shown in the attached chart at BarCount 645. The peaks and troughs are not at where they should be.

                              The ZZ uses getCurrentBarIndex() to get bar index as x coordinate for drawLineAbslolute() to plot the ZZ line. Note that replacing drawLineAbslolute() with drawLineRelative() leads to an incomprehensible plot (any comment ??).

                              Jason explained that because of the execution sequence of each efs, historical bar indices are not updated in forward charting/computation (in real time and tick replay). getCurrentBarIndex() returns 0 as bar index for bar 0, and this value unchanged as the bar becomes historical (moves to the left of the chart). I understand that. And that is a main reason for unsatisfactory graphical presentation of data/indicators, which in a crowded chart can easily cause confusions and mistakes in analysing chart, developing trading techniques, and worse, trading decisions (already happenned to me!!).

                              How to overcome this drawback ? so we can have correct graphical presentation of data/indicator values. I have tried the following:

                              1. Reload each efs on the chart manually. This should be ok for a chart with a reasonably long chart interval (say, >30s) and few simple efs. For a chart with a short chart interval (such as tick chart) and a couple of complex efs, the total time to manually reload all efs can be significantly long (I already experienced minutes manual reloading). During that reloading period traders are out of the market, cann't do anything but wait. Another problem is the plots are not synchronised because we manually reload efs one by one.

                              2. Use reloadEFS(). I thought this function can be used within each efs to do the reloading automatically. I used it in one of my efs to test (despite very limited use guide for it). The results were it closed/logged eSignal off every time I used that efs. I later learned from Jay F that reloadEFS() can make infinite looping and can cause crash and should not be used.

                              Any other way ???

                              Any comments, help to get pass this issue will be greatly appreciated

                              Regards
                              Dzung Nguyen
                              Attached Files
                              Last edited by dungn6au47; 08-28-2003, 01:53 PM.

                              Comment

                              Working...
                              X