Announcement

Collapse
No announcement yet.

Simple ADX EFS question/help

Collapse
This topic is closed.
X
X
 
  • Filter
  • Time
  • Show
Clear All
new posts

  • Simple ADX EFS question/help

    I am having trouble in figuring out the following.
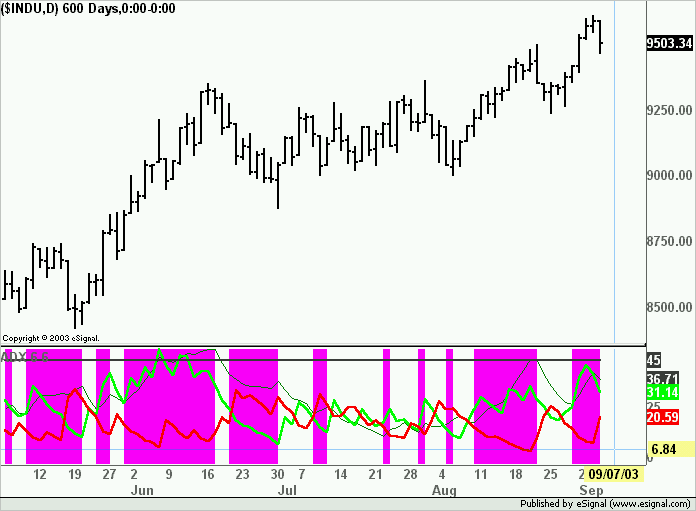
    If the difference between the red and lime line ( + _) is greater then 10, change background color to magenta.

    Currently it changes color if + is greater then - then green background appears and opposite for - greater then +

    var study = new ADXDMStudy(6, 6);

    function preMain() {
    setStudyTitle("ADX 6 6");
    setDefaultBarFgColor(Color.green, 0); // ADX
    setDefaultBarFgColor(Color.lime, 1); // PDI
    setDefaultBarFgColor(Color.red, 2); // NDI
    setDefaultBarFgColor(Color.darkgrey, 3);
    setDefaultBarThickness(2,3);
    setCursorLabelName("0",0);
    setCursorLabelName("+",1);
    setCursorLabelName("-",2);
    setCursorLabelName("0",3);
    setDefaultBarThickness(0,0);
    setDefaultBarThickness(2,1);
    setDefaultBarThickness(2,2);
    setPlotType(PLOTTYPE_INSTANTCOLORLINE);
    setStudyMin(0);
    setStudyMax(50);
    }

    function main() {
    var vADX = study.getValue(ADXDMStudy.ADX);
    var vPDI = study.getValue(ADXDMStudy.PDI);
    var vNDI = study.getValue(ADXDMStudy.NDI);
    var UpBand1 = 45;

    if(vPDI > vNDI)
    {
    setBarBgColor(Color.green);
    }
    if(vPDI < vNDI)
    {
    setBarBgColor(Color.maroon);
    }
    return new Array(vADX, vPDI, vNDI, UpBand1);
    }
  • #2
    Earl
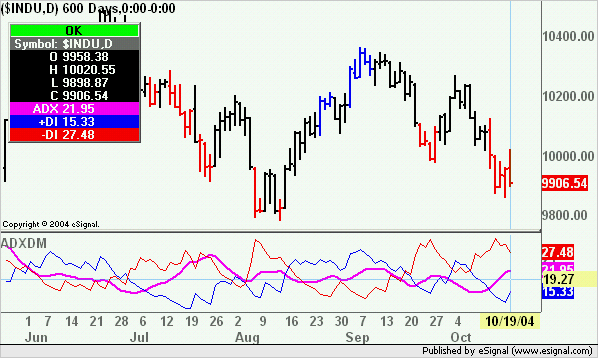
    Here is the same code slightly modified. I have commented out your conditions and added the one you requested.
    Alex

    PHP Code:
    var study = new ADXDMStudy(66);

    function 
    preMain() {
    setStudyTitle("ADX 6 6");
    setDefaultBarFgColor(Color.green0); // ADX
    setDefaultBarFgColor(Color.lime1); // PDI
    setDefaultBarFgColor(Color.red2); // NDI
    setDefaultBarFgColor(Color.darkgrey3);
    setDefaultBarThickness(2,3);
    setCursorLabelName("0",0);
    setCursorLabelName("+",1);
    setCursorLabelName("-",2);
    setCursorLabelName("0",3);
    setDefaultBarThickness(0,0);
    setDefaultBarThickness(2,1);
    setDefaultBarThickness(2,2);
    setPlotType(PLOTTYPE_INSTANTCOLORLINE);
    setStudyMin(0);
    setStudyMax(50);
    }

    function 
    main() {
    var 
    vADX study.getValue(ADXDMStudy.ADX);
    var 
    vPDI study.getValue(ADXDMStudy.PDI);
    var 
    vNDI study.getValue(ADXDMStudy.NDI);
    var 
    UpBand1 45;

    //if(vPDI > vNDI)
    if ((vPDI-vNDI)>10||(vPDI-vNDI)<-10)
    {
    setBarBgColor(Color.magenta);
    }
    //if(vPDI < vNDI)
    //{
    //setBarBgColor(Color.maroon);
    //}
    return new Array(vADXvPDIvNDIUpBand1);

    Last edited by ACM; 09-07-2003, 11:15 AM.

    Comment


    • #3
      Last Tweek for this EFS

      Alex, it works perfectly. The background turns color when there is a difference of more then 10 between the 2 lines.
      The last thing is can I get the same lets say magenta background change when all of the conditions are met PLUS only if the positive line is above the negative line. At that point the other line if 10 points differecnce or more with the red or negative line being on top could turn the background maroon.

      I basically want the color change to match which line, positive or negative is the predoniment one or stronger one. This is probable about 1/4 of a line.
      Thanks

      Comment


      • #4
        Earl
        Simply break apart the following condition
        if ((vPDI-vNDI)>10||(vPDI-vNDI)<-10)
        into two separate conditions each with its own set of relative actions (like you had the script originally)
        if((vPDI-vNDI)>10) is the condition for magenta and
        if((vPDI-vNDI)<-10) is the condition for maroon
        Alex

        Comment


        • #5
          Almost there on EFS

          I inserted as you suggested but still not turning colors if red is above green with 10 point seperation. Could you check my last few lines Line 35-42
          Thanks
          var study = new ADXDMStudy(6, 6);

          function preMain() {
          setStudyTitle("ADX play10 Point Difference 6 6");
          setDefaultBarFgColor(Color.green, 0); // ADX
          setDefaultBarFgColor(Color.lime, 1); // PDI
          setDefaultBarFgColor(Color.red, 2); // NDI
          setDefaultBarFgColor(Color.darkgrey, 3);
          setDefaultBarFgColor(Color.darkgrey, 4);
          setDefaultBarBgColor(Color.grey);
          setDefaultBarThickness(2,3);
          setDefaultBarThickness(2,4);
          setCursorLabelName("0",0);
          setCursorLabelName("+",1);
          setCursorLabelName("-",2);
          setCursorLabelName("0",3);
          setCursorLabelName("0",4);
          setDefaultBarThickness(0,0);
          setDefaultBarThickness(2,1);
          setDefaultBarThickness(2,2);
          setDefaultBarThickness(2,3);
          setDefaultBarThickness(3,4);
          setPlotType(PLOTTYPE_INSTANTCOLORLINE);
          setStudyMin(0);
          setStudyMax(50);
          }

          function main() {
          var vADX = study.getValue(ADXDMStudy.ADX);
          var vPDI = study.getValue(ADXDMStudy.PDI);
          var vNDI = study.getValue(ADXDMStudy.NDI);
          var UpBand1 = 45;
          var UpBand2 = 25;

          //if(vPDI > vNDI)
          if ((vPDI >vNDI)||(vPDI-vNDI)>10||(vPDI-vNDI)<-10)
          {
          setBarBgColor(Color.blue);
          }
          //if(vPDI < vNDI)
          if ((vPDI <vNDI)||(vPDI-vNDI)>10||(vPDI-vNDI)<-10)
          {
          setBarBgColor(Color.maroon);
          }
          return new Array(vADX, vPDI, vNDI, UpBand1, UpBand2);
          }

          Comment


          • #6
            Earl
            You did not break apart the condition as I suggested.
            The original condition is
            if ((vPDI-vNDI)>10||(vPDI-vNDI)<-10)
            which means
            IF ((vPDI-vNDI) is greater than 10 OR (vPDI-vNDI) is less than -10 THEN set the color to magenta
            What you have in your conditions now is
            if ((vPDI >vNDI)||(vPDI-vNDI)>10||(vPDI-vNDI)<-10)
            which means
            IF((vPDI is greater than vNDI) OR (vPDI-vNDI) is greater than 10 OR (vPDI-vNDI) is less than -10)
            and you repeat the same exact conditions in the second set.
            Now by definition if(vPDI-vNDI)>10 it also means that vPDI>vNDI and conversely if (vPDI-vNDI)< -10 it also means that vPDI<vNDI so you do not need to set those statements in the conditions.
            All you need is if((vPDI-vNDI)>10) then color magenta and as the second condition if((vPDI-vNDI)<-10) then color maroon
            Alex
            Last edited by ACM; 09-08-2003, 10:05 AM.

            Comment


            • #7
              bar color on di's

              Alex: I have tried w/o success - I am trying to get this efs to change the bar colors (blue for pdi>ndi and red for ndi>pdi) when the values exceed an adjustable level...ie 10. Any help woul dbe greatly appreciated...Thanks...

              Steve

              Comment


              • #8
                Steve
                The attached efs will color the price bars in blue if the PDI is greater than the NDI by a user defined threshold and in red if lesser than the defined threshold.
                All parameters for the ADX study and the threshold level can be modified through Edit Studies
                Alex

                Attached Files

                Comment


                • #9
                  Thanks...

                  Works perfectly Alex - thank you very much.

                  Comment


                  • #10
                    similar task...

                    Alex: Your formula works great. I also want to use a similar confirming indicator as well, could you tell me (or show me) how to color the bars (different chart of course) when a moving average crosses over a linear regression line (or vice versa). If possible, I want to be able to change the parameters of the moving average, as well as parameters of the the linear regression line. Thanks for your help - it is certainly appreciated...

                    Steve

                    Comment


                    • #11
                      Steve
                      I don't know which linear regression line you are referring to.
                      Irrespective you can use the attached efs that colors the bars on the crossing of two averages as an example and substitute the second average with whatever linear regression study you plan to use.
                      Alex
                      Attached Files

                      Comment


                      • #12
                        Indicator used...

                        Alex - Thanks for the prompt reply. I don't know how to substitute the Linear Regression Indicator for one of the moving averages, - but the one I use is shown below - if you could switch it for me...Thanks for your help!!!

                        // Provided by eSignal (c) 2003 //
                        ////////////////////////////////////////////////////////////////
                        function preMain()
                        {
                        setStudyTitle("Linear Regression Indicator");
                        setCursorLabelName("LR", 0);
                        setDefaultBarFgColor(Color.red, 0);
                        setDefaultBarThickness(3, 0);
                        setPriceStudy(true);
                        }

                        function main(Length) {
                        if(Length == null) Length = 5;
                        var sum = 0;
                        var i = 0;
                        var mt = 0;
                        var wt = 0;
                        for(i = Length; i > 0; i--)
                        sum += (i - (Length + 1) / 3) * close(i - Length);
                        wt = 6 / (Length * (Length + 1)) * sum
                        return wt;
                        }

                        Comment


                        • #13
                          Steve
                          The attached efs incorporates the Linear Regression study which is used to replace the second MA of the prior script.
                          I have commented out the unused portions of the original efs so that you can see how the changes were implemented.
                          Alex
                          Attached Files

                          Comment


                          • #14
                            Thanks...

                            Thanks again Alex - it works perfectly...

                            Comment


                            • #15
                              Arrows Instead?

                              Hi Alex:

                              Is it possible to change the great formula you wrote (basicmaxlr(paintbar))...so that instead of painting the bars, it just shows small red or blue arrows? That would be wonderful. Perhaps red arrows above the bars pointing down and blue arrows below pointing up, etc...Anway, I appreciate all your help!

                              Thanks,

                              Steve

                              Comment

                              Working...
                              X