 Tweet
Tweet
Can anyone help me with this?
I am trying to plot the first 60 minute bar of a chart with the following code (It has taken he all weekend to get this far but it seems to work)
function preMain() {
setPriceStudy(true);
setDefaultBarFgColor(Color.grey,0);
setDefaultBarFgColor(Color.grey,1);
setDefaultBarFgColor(Color.grey,2);
setDefaultBarThickness(1,0);
setDefaultBarThickness(1,1);
setDefaultBarThickness(1,2);
setPlotType(PLOTTYPE_FLATLINES,0);
setPlotType(PLOTTYPE_FLATLINES,1);
setPlotType(PLOTTYPE_FLATLINES,2);
}
function main(){
var vTime = getValue("Time");
if (vTime != null) {
var vFirstBar = getFirstBarIndexOfDay( vTime );
if (vFirstBar != null) {
v60minHigh = getValueAbsolute( "high", vFirstBar );
v60minLow = getValueAbsolute( "low", vFirstBar );
v60minClose = getValueAbsolute( "close", vFirstBar );
}
}
drawLineRelative( -20, v60minHigh, 0, v60minHigh, PS_DASH, 1, Color.green, 0) // First bar high
drawLineRelative( -20, v60minClose, 0, v60minClose, PS_DASH, 1, Color.green, 1) // First bar low
drawLineRelative( -20, v60minLow, 0, v60minLow, PS_DASH, 1, Color.green, 2) // First bar close
}
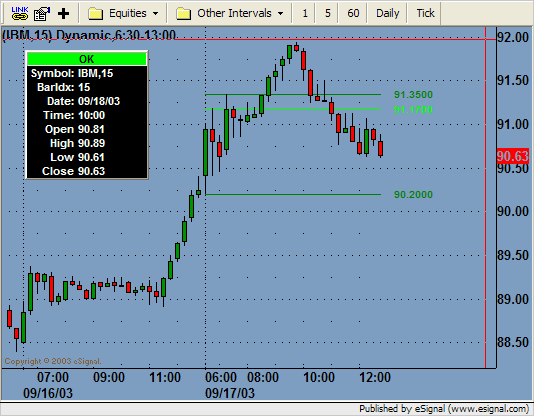
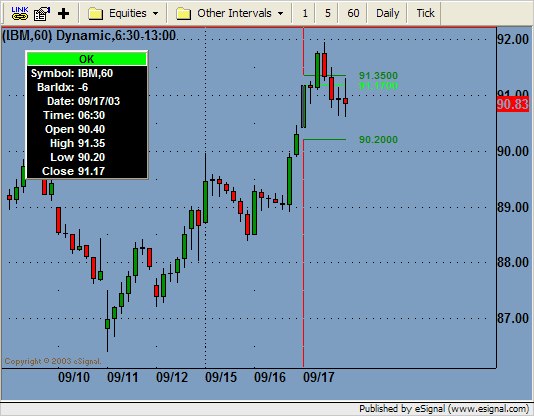
However, when I change the chart interval the lines are plotted using the new time interval, which I don't want to happen. Is there anyway I can plot the lines on a 60 minute chart so that when I change intervals, the plotted lines stay put?
Thank you
I am trying to plot the first 60 minute bar of a chart with the following code (It has taken he all weekend to get this far
but it seems to work)function preMain() {
setPriceStudy(true);
setDefaultBarFgColor(Color.grey,0);
setDefaultBarFgColor(Color.grey,1);
setDefaultBarFgColor(Color.grey,2);
setDefaultBarThickness(1,0);
setDefaultBarThickness(1,1);
setDefaultBarThickness(1,2);
setPlotType(PLOTTYPE_FLATLINES,0);
setPlotType(PLOTTYPE_FLATLINES,1);
setPlotType(PLOTTYPE_FLATLINES,2);
}
function main(){
var vTime = getValue("Time");
if (vTime != null) {
var vFirstBar = getFirstBarIndexOfDay( vTime );
if (vFirstBar != null) {
v60minHigh = getValueAbsolute( "high", vFirstBar );
v60minLow = getValueAbsolute( "low", vFirstBar );
v60minClose = getValueAbsolute( "close", vFirstBar );
}
}
drawLineRelative( -20, v60minHigh, 0, v60minHigh, PS_DASH, 1, Color.green, 0) // First bar high
drawLineRelative( -20, v60minClose, 0, v60minClose, PS_DASH, 1, Color.green, 1) // First bar low
drawLineRelative( -20, v60minLow, 0, v60minLow, PS_DASH, 1, Color.green, 2) // First bar close
}
However, when I change the chart interval the lines are plotted using the new time interval, which I don't want to happen. Is there anyway I can plot the lines on a 60 minute chart so that when I change intervals, the plotted lines stay put?
Thank you
Comment