Announcement

Collapse
No announcement yet.

MA and Volume on the same sub-graph

Collapse
X
 
  • Filter
  • Time
  • Show
Clear All
new posts

  • MA and Volume on the same sub-graph

    Hi,

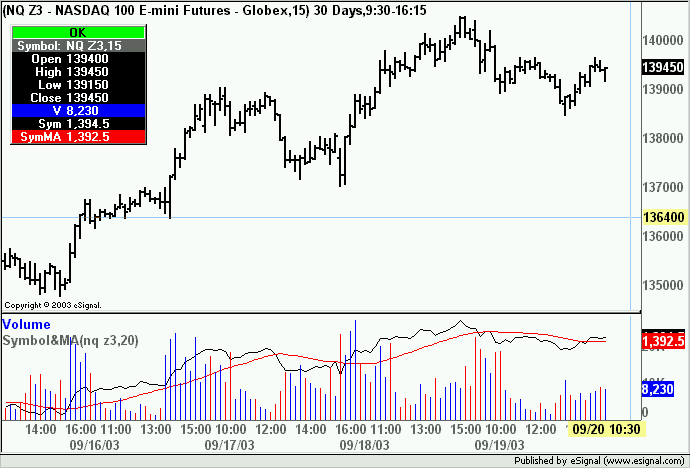
    Is it possible to take a moving average plotted on the NQ on a lower graph display and overlay the volume onto the same lower graph.

    If my thinking is correct, I may not be able to do this since the scaling of the two plotted items, ma and volume, are on two very different scales.

    Any help or comments?

    thanks,

    EZ

  • #2
    EZ
    Although like you correctly say the scales are very different the new overlay feature in version 7.5 is quite sophisticated and can easily handle what you are asking.
    In the image below an efs plotting the Close of NQ Z3 and a 20 period MA of the Close is overlayed to the Volume plot for the same symbol
    Alex

    Comment


    • #3
      Empty File

      Alex,

      I downloaded the Volume(Sym)+MA file from the ACM Test folder. However, when I tried to add it to my adv chart it came up with a blank space. I tried to open the file with the Editor but there was nothing there either. Could you please enlighten me on how to get the same sort of study that you have shown in the previous reply? Thanks a lot.

      Sesh

      Comment


      • #4
        Sesh
        Apparently there was an issue with the name of that file. I have uploaded a new copy as Volume(Sym)MA.efs and it should be working fine now.
        Alex

        Comment


        • #5
          Questions

          Alex,

          Thanks for the prompt response. I have two questions:

          1. The new file that you provided gives a study which has the volume (histogram) and MA of volume only (of the stock/future?) but not the third line you have on your chart example. It looks like the study that is in the Library folder already. So what am I missing?

          2. Is it possible to include an editable option to change the type of MA to exponential, simple, weighted or volume weighted like the other efs studies that you have done?

          Thanks a lot for your help.

          Sesh

          Comment


          • #6
            Please ignore the first part

            Alex,

            Just after typing the last reply I realized how you got the third line - it is overlayed. So please ignore the first question. Thanks.

            Sesh

            Comment


            • #7
              Line missing

              I have downloaded the volume (sym) ma study but mine shows up with only one moving average and the volume histogram. The second line is not showing. Did I perhaps dowloaded the wrong file Volume(sym)MA ?

              Thank you very much

              Comment


              • #8
                fanie
                Volume(Sym)MA.efs only plots the volume and a moving average of the volume for a symbol other than the one in the price window.
                In the image shown earlier in this thread I was using a different efs that I have not yet posted that plots the close line of a symbol and a moving average of that. That efs is somewhat similar to the one I posted for you that plots an 18 period ema of $ADD.
                Alex

                Comment


                • #9
                  Alex,

                  I thought that you had overlaid an MA study on the volume MA study to get the kind of study you had posted. So I tried to do the same and all that I am getting for the MA (of the price) is a straight line. Your last post explains the mystery. So you have developed another efs which does that. Could please post that? Also would it be possible to include other moving averages like exponential, weighted as well as the simple average for the price and volume. Thanks.

                  Sesh

                  Comment


                  • #10
                    SMA version of two different symbols

                    Hi Alex, I was looking to plot the 10 Simple MA of the Advancing Issues Volume versus the 10SMA of the Declining issues Volume of Nasdaq stocks. Ie $ADVQ and $DECLQ in the same indicator panel.
                    Seshadri's request below would be a big help if you're able to help us out. But I'm a bit puzzled as to how/if I'm able to get two different symbols on the same indicator? (I just wanted to plot the two MA's on the same indicator)
                    Can you help please?
                    Many thanks.

                    Comment


                    • #11
                      hhooper
                      At the moment the efs I am trying to write does not accomplish what you ask and is incomplete anyhow.
                      If and when I finish it and it matches the way the other scripts I posted work I will uploaded it to my group and let you know.
                      Alex

                      Comment


                      • #12
                        MA & Volume

                        Ok thanks alex, appreciate that. Just one thing, MA aside, is it easy to manually merge indicators for two separate symbols like this. I understand that the merge function is usually the SHIFT key for two indicators under the same symbol. I also understand that you can overlay symbols on the price chart, but is there somewhere between these two processes so that I can manually merge indicators from two symbols??
                        Thanks once again

                        Comment


                        • #13
                          hhooper
                          If you have a study that does that then version 7.5 makes it very easy to create overlays as it now matches the scales.
                          Alex

                          Comment

                          Working...
                          X