Announcement

Collapse
No announcement yet.

Fill region between two MA's

Collapse
X
 
  • Filter
  • Time
  • Show
Clear All
new posts

  • Fill region between two MA's

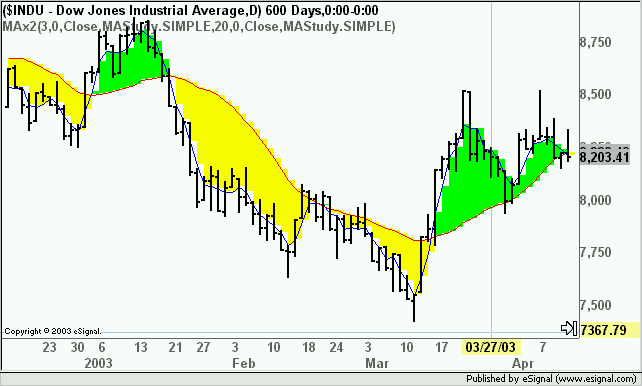
    I need a way to colorize the region between two MA's.

    HISTOGRAM would seem to be the easiest, but the BASE can't be changed dynamically.

    I tried using lines, but performance degraded severely. Maybe I did it wrong.

    Any other ideas?

  • #2
    crescentbeach
    Attached efs shows you how to do it.
    Alex

    Attached Files

    Comment


    • #3
      Alexis , is there someway to only plot small dots between the averages?? the problem with this solution is that if i draw a trendline it gets invisible behind the fields that are colored.

      thanks

      Comment


      • #4
        pq1
        Right click the chart, select Properties and put a check mark in "Draw Lines On Top of Price"
        Alex

        Comment


        • #5
          LOL , that solution was so easy, that i have completely missed it.

          thanks Alex

          Comment


          • #6
            Thanks, Alex.

            I see that your solution utilizes setBarBgColor parameters that aren't documented anyplace I can find in
            http://www.esignalcentral.com/univer...html/hs600.htm


            Where can I find documentation on the parameters you used? Are there undocumented parameters for other functions, too?

            Comment


            • #7
              cresent beach

              http://share.esignal.com/groupconten...le&groupid=114

              has most of the command in a help file

              Comment


              • #8
                crescentbeach
                The syntax for the setBarBgColor() parameters is as follows.
                setBarBgColor(Color, [Series], [yMin], [yMax]);
                Values in square brackets are optional. You can also use null as yMin or yMax value to indicate "lower" and "higher".
                yMin = 80, yMax = null means 80 and higher
                yMin = null, yMax = 20 means 20 and lower
                Alex
                Last edited by ACM; 09-23-2003, 09:52 AM.

                Comment


                • #9
                  Thanks for the info, Alex.

                  Is there documentation for other functions that have additional parameters?

                  I checked the hlp file dloomis recommended, and its as incomplete as the on-line docs.

                  Comment

                  Working...
                  X