Announcement

Collapse
No announcement yet.

changing colors of study from "edit studies"

Collapse
X
 
  • Filter
  • Time
  • Show
Clear All
new posts

  • changing colors of study from "edit studies"

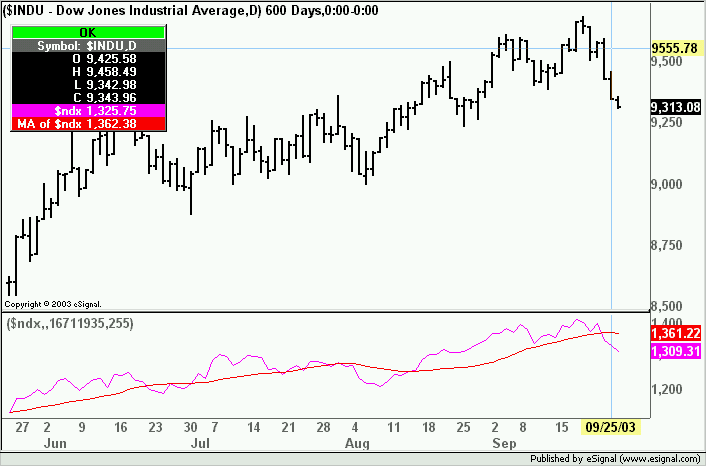
    Need a little help with something I can't seem to find the answer to. Down below you will see the code for a nice little efs that plots a symbol with its moving average as a non price study. The default colors are blue for the indicator and red for its moving average. If click on the "edit studies" you can change the color. EXCEPT, when you change the color both the indicator and its moving average change colors. So. How would one change the efs so that both the indicator and its moving average can have their colors and line widths changed independently from the "edit studies" window?

    thanks

    efs code follows:

    /*********************************
    Provided By : eSignal. (c) Copyright 2003
    *********************************/

    /* plots a symbol and its mov ave as an indicator 6-13-03 **/

    var vLoaded = false;
    var cSym = "";
    var vSym = null;
    var vMAArray = new Array();

    function preMain() {
    if (vLoaded == false) {
    setStudyTitle(" ... Add Symbol");
    setCursorLabelName("Add Symbol");
    setDefaultBarFgColor(Color.blue,0);
    setDefaultBarFgColor(Color.red,1);
    } else {
    if (vSym != null) {
    setStudyTitle(" ");
    setCursorLabelName(vSym,0);
    setCursorLabelName("MA of "+vSym,1);
    } else {
    setStudyTitle(" ... Add Symbol");
    setCursorLabelName("Add Symbol");
    }
    }
    }

    function main(Symbol1,nMALength) {
    if (vLoaded == false) {
    cSym = getSymbol();

    if (Symbol1 == null) {
    vSym = null;
    } else {
    vSym = Symbol1;
    }
    vLoaded = true;

    preMain();
    }

    if (nMALength == null) {
    nMALength = 20;
    } else {
    nMALength = Math.round(nMALength);
    }

    if (vSym != null) {
    var b = close(vSym);

    var nBarState = getBarState();

    if (nBarState == BARSTATE_NEWBAR) vMAArray.unshift(b); //inserts array element to the front of the array

    vMAArray[0] = b;

    if (vMAArray[nMALength-1] != null) {

    var vSum = 0;

    for (i=0; i <= nMALength-1; i++) {
    vSum += vMAArray[i];
    }

    var vMA = vSum / nMALength;

    }

    return new Array (b,vMA);

    } else {
    return;
    }
    }
  • #2
    bigtee
    You can find an example on how to do it in this message.
    Alex

    Comment


    • #3
      Thanks, Alex. The example looks good, but I am having difficulties getting it to work. I defined the function parameters in the premain, put them in the main, and just before the return per your example, but I get an error when I load it. The error says "Parameter 1 of setBarFgColor is invalid. Where is my error?

      Code follows:


      /*********************************
      Provided By : eSignal. (c) Copyright 2003
      *********************************/

      /* plots a symbol and its mov ave as an indicator 6-13-03 **/

      var vLoaded = false;
      var cSym = "";
      var vSym = null;
      var vMAArray = new Array();

      function preMain() {

      if (vLoaded == false) {
      setStudyTitle(" ... Add Symbol");
      setCursorLabelName("Add Symbol");
      setDefaultBarFgColor(Color.blue,0);
      setDefaultBarFgColor(Color.red,1);
      } else {
      if (vSym != null) {
      setStudyTitle(" ");
      setCursorLabelName(vSym,0);
      setCursorLabelName("MA of "+vSym,1);
      } else {
      setStudyTitle(" ... Add Symbol");
      setCursorLabelName("Add Symbol");
      }
      }

      var fp1 = new FunctionParameter("sColor", FunctionParameter.COLOR); //for the symbol
      fp1.setName("Symbol-Color"); //optional name to show in Edit Studies
      fp1.setDefault(Color.blue); //default color in Edit Studies

      var fp2 = new FunctionParameter("maColor", FunctionParameter.COLOR); //for the Moving Average
      fp2.setName("MA-Color"); //optional name to show in Edit Studies
      fp2.setDefault(Color.red); //default color in Edit Studies

      }


      function main(Symbol1,nMALength,sColor,maColor) {
      if (vLoaded == false) {
      cSym = getSymbol();

      if (Symbol1 == null) {
      vSym = null;
      } else {
      vSym = Symbol1;
      }
      vLoaded = true;

      preMain();
      }

      if (nMALength == null) {
      nMALength = 20;
      } else {
      nMALength = Math.round(nMALength);
      }

      if (vSym != null) {
      var b = close(vSym);

      var nBarState = getBarState();

      if (nBarState == BARSTATE_NEWBAR) vMAArray.unshift(b); //inserts array element to the front of the array

      vMAArray[0] = b;

      if (vMAArray[nMALength-1] != null) {

      var vSum = 0;

      for (i=0; i <= nMALength-1; i++) {
      vSum += vMAArray[i];
      }

      var vMA = vSum / nMALength;

      }

      setBarFgColor(sColor, 0); //the number assigns the color to the first item in the return
      setBarFgColor(maColor, 1);

      return new Array (b,vMA);

      } else {
      return;
      }
      }

      Comment


      • #4
        bigtee
        Seems to be working fine here.
        The only thing missing IMHO is that when the efs is first loaded there is no symbol associated (at least that is what is happening here).
        So I added one command in Line 14 that will ask for user inputs when the efs is first loaded in the chart.
        Attached is the efs with the added command.
        Alex

        Attached Files

        Comment


        • #5
          Thanks again Alex. Both mine and yours now work. Not sure why. I shut eSignal down and restarted it and then they both worked. Who knows?

          Anyway, one last question. Is there a way to prevent the colors ( or any selected variables for that matter) from showing in the title? For example I was looking at your MaofMA indicator which has a bunch of options. Yet none of them show in the title. Is the difference because the MaofMa is a price study?

          Your little tutorial should be in the help files somewhere. Great work.

          Comment


          • #6
            bigtee
            The options in MAofMA don't show up until the moment you edit one of the parameters. Once you do that they too will show up in the title.
            There is a way to prevent all those parameters from showing up in the chart but it is an "all or none" proposition ie you cannot apply it to a specific efs individually.
            Right click the chart, select Properties and uncheck Draw Study Titles. That will prevent the titles from all studies from appearing in the chart.
            Last but not the least thank you very much for your compliments.
            Alex
            Last edited by ACM; 09-27-2003, 02:36 PM.

            Comment

            Working...
            X