Announcement

Collapse
No announcement yet.

I don't want yesterday's alerts

Collapse
X
 
  • Filter
  • Time
  • Show
Clear All
new posts

  • I don't want yesterday's alerts

    Hi,

    Hope someone can help me with this.

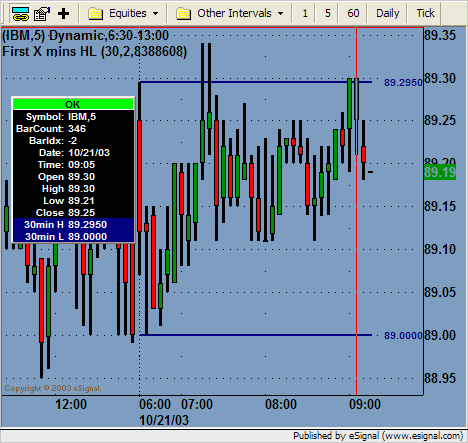
    I've got a formula that marks the high and low of the first 15 min trading of the day.
    Problem is it also has the previous day's equivalent (and previous days as well). How can I get the formula to only show me the current day's 15 min high/low.

    Many thanks for your help.

    Mephisto.

  • #2
    If you post the file, it will be a simple matter to make the change you need.

    Comment


    • #3
      Hi,

      I've posted the chart for your help:

      var vDonchian = new DonchianStudy(7, 0); //change the 7 to the number of bars before 1000EST
      // this is done by taking the interval in minutes divided into 60, so for a 5 min chart, 60/5 is 7

      function preMain()
      {
      setPriceStudy(true);
      setStudyTitle("CrystalBall");
      setCursorLabelName("30m H", 0);
      setCursorLabelName("30m L", 1);
      setDefaultBarStyle(PS_SOLID, 0);
      setDefaultBarStyle(PS_SOLID, 1);
      setDefaultBarFgColor(Color.blue, 0);
      setDefaultBarFgColor(Color.blue, 1);
      setDefaultBarThickness(1, 0);
      setDefaultBarThickness(1, 1);
      setPlotType(PLOTTYPE_LINE, 0);
      setPlotType(PLOTTYPE_LINE, 1);


      // Set the "StartTime" to 10:00EST in your timezone (eg UK would be 1500)
      StartTime=1500
      }

      function main()
      {
      BarHr = getHour();
      BarMin = getMinute();
      cBarTimeInt =BarHr*100+BarMin*1;

      if(cBarTimeInt<StartTime)
      {
      hrOne=0;
      CrystalBalled=0;
      return null;
      }


      if(cBarTimeInt>=StartTime
      && hrOne==0){
      hrOne=1;
      hrOneHi=vDonchian.getValue(DonchianStudy.UPPER);
      hrOneLo=vDonchian.getValue(DonchianStudy.LOWER);
      return new Array(high(), low());
      }

      if(hrOne==1)
      {
      CrystalBall= (close()-hrOneLo) / (hrOneHi-hrOneLo);

      if(CrystalBall>0.9 && CrystalBall<1 && CrystalBalled==0)
      {
      Alert.addToList(getSymbol(), "Potential Breakout Long!", Color.RGB(0,0,0), Color.RGB(0,195,0));
      Alert.playSound(".\\Sounds\\New.wav");

      CrystalBalled=1;
      }

      if(CrystalBall<0.1 && CrystalBall>0 && CrystalBalled==0)
      {
      //debugPrintln("Short Signal");
      Alert.addToList(getSymbol(), "Potential Breakout Short!", Color.RGB(0,0,0), Color.RGB(195,0,0));
      Alert.playSound(".\\Sounds\\New.wav");

      CrystalBalled=1;
      }


      return new Array(hrOneHi, hrOneLo);
      }

      return null;

      }

      Comment


      • #4
        Hello Mephisto,

        Here's a formula that will draw the high/low line for the current day for the first X mins of trading. The inputs for the number of minutes, line thickness and color are configurable through the "Edit Studies" option. It doesn't contain the alerts in your code you posted, but you should be able to easily modify the formula to suit your needs.

        FirstXminsHL.efs

        Jason K.
        Project Manager
        eSignal - an Interactive Data company

        EFS KnowledgeBase
        JavaScript for EFS Video Series
        EFS Beginner Tutorial Series
        EFS Glossary
        Custom EFS Development Policy

        New User Orientation

        Comment

        Working...
        X