Announcement

Collapse
No announcement yet.

I got some questions...

Collapse
X
 
  • Filter
  • Time
  • Show
Clear All
new posts

  • I got some questions...

    Hello ...
    my first question is:


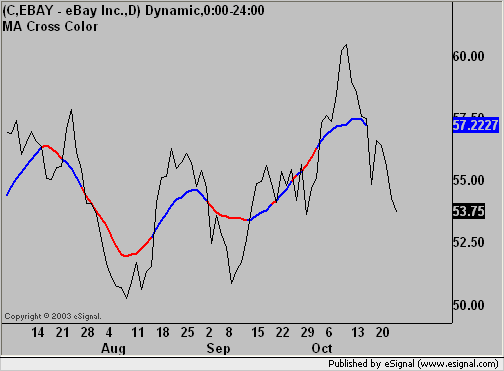
    I have got a Moving avarage with

    Length: 15 and Offset: -6

    is there a way to calculate the red line (i drew it in photoshop)
    so that there are crossingpoints if i take 2 moving avarages with 2 different offsets ?

    My second question is:
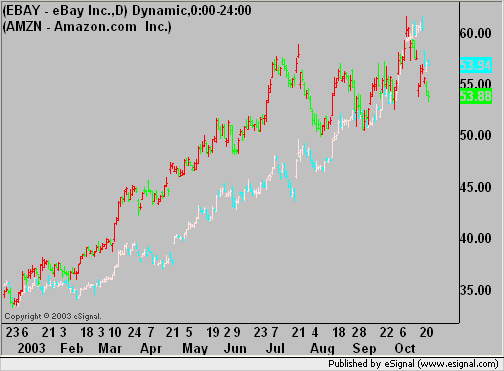
    Is there a way to get 2 charts in one chartwindow ?
    e.g. the $indu and the $daxi

    thank you...
    regards eric

  • #2
    I'll answer your second question first as it's much easier. In eSignal 7.5 Beta, you can overlay up to 4 symbols over the main symbol. Here's EBAY with AMZN overlayed.

    Regards,
    Jay F.
    Product Manager
    _____________________________________
    Have a suggestion to improve our products?
    Click Support --> Request a Feature in eSignal 11

    Comment


    • #3
      The attached Formula Wizard code I believe will do what you are looking for as described in your screenshot. If you wish to add a second MA, then that can be done through the Formula Wizard as well. One main resource for you is the EFS Help Center & Library and in particular the Formula Wizard section.

      Attached Files
      Regards,
      Jay F.
      Product Manager
      _____________________________________
      Have a suggestion to improve our products?
      Click Support --> Request a Feature in eSignal 11

      Comment


      • #4
        Looking at your screenshot further... perhaps that red line is an extention of the offset MA. I tried to create some code for this, but there's certainly some bugs in it. Anyone care to take a shot?
        Attached Files
        Regards,
        Jay F.
        Product Manager
        _____________________________________
        Have a suggestion to improve our products?
        Click Support --> Request a Feature in eSignal 11

        Comment


        • #5
          @ jayf ...
          yes i mean the extension of the ma not the crossingpoint like in your first post...

          i will download the beta and test it... thank you
          so long eric

          Comment


          • #6
            i have downloaded the beta ... but i dont find the option to overlay symbols ... can you describe how to do that please

            regards eric

            Comment


            • #7
              Just start typing in a new symbol in an AC window and you'll see a new button for multiple symbols. Can add up to four.

              Thanks.

              Comment


              • #8
                Put your cursor over the advanced chart and click on it. type in the first symbol. At the bottum of the screen pop-up you will see a button for adding additional symbols.

                Click on multiple symbols...

                Fibbgann
                Attached Files
                Excellent book on JavaScript for beginners

                Comment


                • #9
                  when i create a new chartwindow there is no popup where i can choose multiple. there isnt any popup ...

                  whats wrong with my betaversion ?

                  please help
                  regards eric

                  Comment


                  • #10
                    Eric
                    When you create a new Advanced Chart no dialog box will show because the chart loads with all the defaults (including symbol).
                    Once the chart is open and selected beging typing a new symbol and as you do so a dialog box will appear which will look like the one in the image posted by FibbGann
                    Alex

                    Comment


                    • #11
                      yes but also when i choosed my symbol there was no popup to get more symbols ...
                      i dont understand why the beta isnt working at my pc...

                      regards eric

                      Comment


                      • #12
                        Eric
                        Can you post an image of the dialog box you get when you type on a chart to change a symbol
                        Alex

                        Comment


                        • #13
                          there isnt any box ... nothing . i am wondering why i got this problem
                          maybe this feature isnt working with Windows XP ?!

                          Comment


                          • #14
                            Eric
                            Let me rephrase the question. How do you change symbol in an Advanced Chart?
                            Also what happens when you select an Advanced Chart and type a number on the keyboard to change interval?
                            FWIW the symbol overlay feature works with XP (both editions)
                            Alex

                            Comment


                            • #15
                              erilein

                              Try left clicking on the Advanced Chart, do you see any menus?

                              Good.

                              Now right click on the chart. Did the menu go away?

                              Good.

                              Now type

                              IBM, did a dialogue box come up?

                              Do you see the Multiple Symbol button on the dialogue box?

                              Comment

                              Working...
                              X