Announcement

Collapse
No announcement yet.

Trend Permission screen

Collapse
X
 
  • Filter
  • Time
  • Show
Clear All
new posts

  • Trend Permission screen

    Hi:
    I would to create a trend permission screen. I download this Moving Average Cross from TS Support as a basis for what I wanted to create. I played with this file a bit and I would like some help.

    What I am trying to accomplish is:
    -Plot the 5 SMA, in green
    -Plot the 9 SMA, in red
    -Plot the 18 SMA, in black.

    Bars = Candlesticks

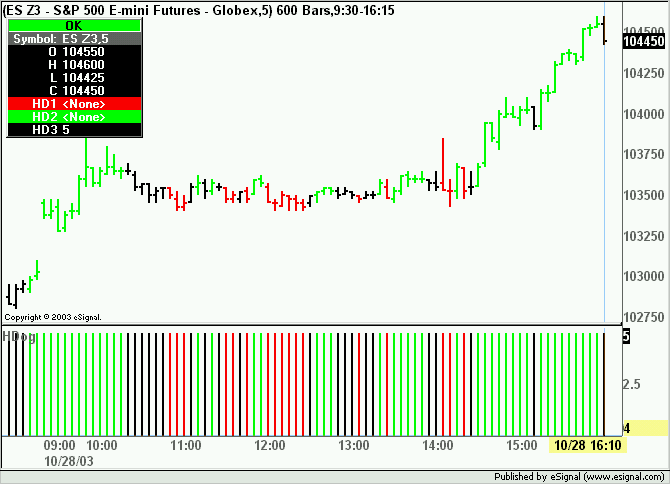
    If the current price is above the 5, 9 and 18, then paint the bar Lime Green.
    If the current price is within the 5, 9 and 18, then paint the bar black.
    If the current price is below the 5, 9 and 18, then paint the bar red.

    Below in the study screen, paint the area, green, black or red similar to the bar.

    Thank you, Harndog
    Attached Files

  • #2
    HDOG

    Place the three simple moving avgerages on the chart and load this efs and see if the output is ok.
    Attached Files

    Comment


    • #3
      Hdog - MA's don't line up with SMA's

      David:
      1. Thank you for your help.
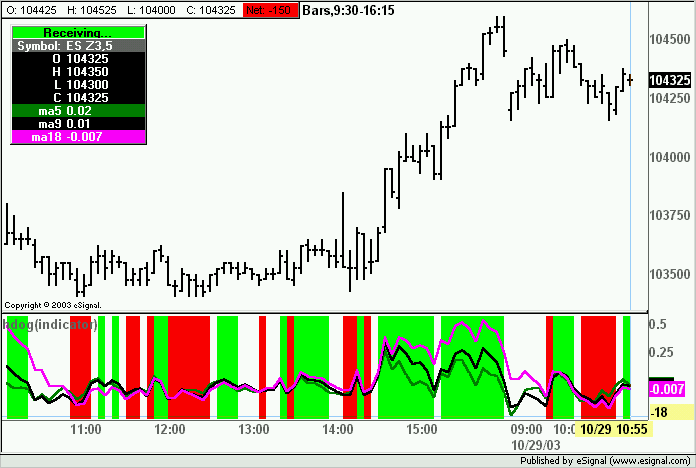
      2. The Indicator study lines do not match up with the ma's.
      3. I have attached an image of the chart.
      4. What I notice is that on today's big up move on the 5 minute, the indicator bars are not green even though price is above all 3 MA's. The indicator bar are actually red on some instead of being green.
      Attached Files

      Comment


      • #4
        Hdog idea

        David:
        What I am hoping to accomplish is creation of a visual permission screen.
        When price is above 5, 9, & 18 MA, the trend is up - take longs & don't fade the trend. When the moving averages are confused (black) Range trade or avoid. And, when the MA's are red, look for shorts.
        Bill Williams uses the 3 MA offset 5, 5 offset 8 and 13 offset 8 to create the "Allegator." The concept is not to feed the "Allegator" when price is in a strong uptrend.
        Harndog
        Attached Files

        Comment


        • #5
          Williams 3 line as an image - permission screen

          Hi:
          Attached is the permission screen and Williams 3 Lines
          Attached Files

          Comment


          • #6
            Permission screen as indicator only

            Hi:
            Another idea:
            Price oscillator is compares current price to 5 bar SMA. Green is price above 5 SMA.
            Harndog
            Attached Files

            Comment


            • #7
              Harndog
              Attached revision paints the indicator lines accordingly
              Alex

              Attached Files

              Comment


              • #8
                Thank you

                Thank you, Alex and David.

                Harndog

                Comment


                • #9
                  permissiom screen

                  Hi Harndog

                  Where I can find Permission Screen as Indicator, Can you help?

                  Thanks
                  sukh

                  Comment


                  • #10
                    Permission Screen

                    Hi:

                    By permission screen, I saying that in my trading, I want to avoid trading against the trend. So, I have made up (through reading articles and Bill Williams 3 line indicator) that the trend is price above the 5, 9 & 18 SMA. I did this as price normally (85% of the time) moves within a range, I wanted a simple indicator to see if price is in a range or trending.

                    What would be helpful, or the next step is to have Hdog.efs coded just as an indicator study. If this was done, it would be possible to move from time frame to time frame and see what the price trend (as defined by the 5, 9 & 18 SMA) are doing. Also, there are other indicator studies available in eSignal that are very good in describing "data trend."

                    If you check out the "XTL" study from Advanced Get or search for XTL in the bulletin board you can read threads about this study. A good thread is "XTL Continuation trade."

                    The XTL study does something called the "Run's Test" to determine if the data is normally or abnormally skewed. Data skew is "how normally is data distributed over a certain period as compared to what is expected by a normal (bell shape) distribution?" If the data is skewed positive the price bar is colored/painted blue. If, the data is normal, the price bar is painted black. And if, the data is skewed negative, the price bar is painted red.

                    If you have any more questions, please ask,
                    Harndog

                    Comment


                    • #11
                      Harndog

                      Alex: Can you or is it possible to create Hdog as an indicator as an study rather just on the price bars?

                      The attached should do what you asked. It was created with the Formula Wizard which can be used to view/edit the code
                      Alex

                      Attached Files

                      Comment


                      • #12
                        hdog as just an indicator

                        Alex:

                        Thank you for the corrected hdog.efs. I looked at the formula editor to see if I could take off the "paint the bars feature" so I could use the permission screen in another chart as an indicator study.

                        When you get some free time could you do this?

                        Harndog

                        Comment


                        • #13
                          Thank you Alex!

                          Thank you!
                          Harndog

                          Comment


                          • #14
                            Harndog
                            You are welcome.
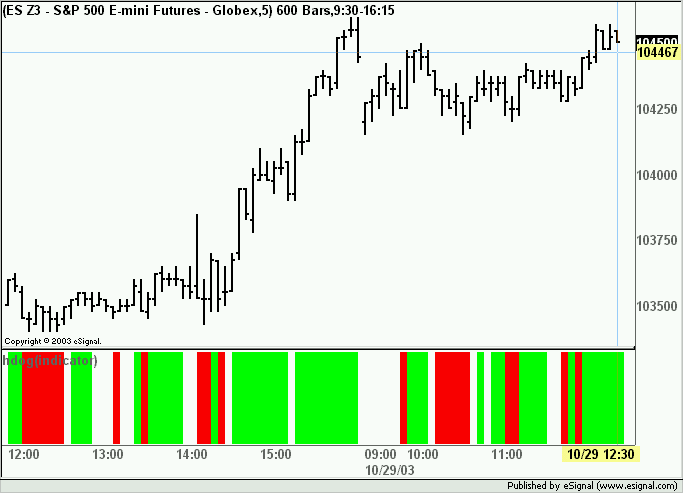
                            FYI if you want you can edit the formula and remove the Returned Data Points to show only the background color in the indicator pane.
                            Alex

                            Comment


                            • #15
                              Alex,
                              Comparing the hdog(indicator).efs with your abillw_3lines.efs the colors in the hdog(indicator).efs don't seem to match up.

                              I think the problem is the MA's in the hdog(indicator).efs hasn't been offset like in the abilw_3lines.efs.

                              I looked for something in the efs to see if there was anything obvious that I could change and didn't see anything.

                              Thanks,
                              Russ
                              Attached Files

                              Comment

                              Working...
                              X