Announcement

Collapse
No announcement yet.

Trendchange ?!

Collapse
X
 
  • Filter
  • Time
  • Show
Clear All
new posts

  • Trendchange ?!

    I got a new question
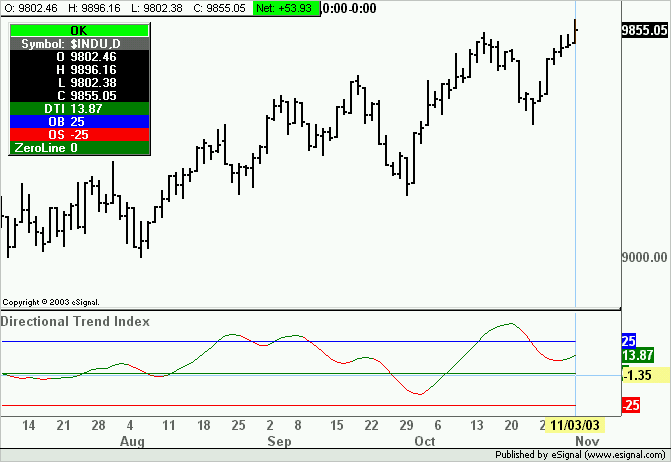
    i want to check (with a esf formula) if there is a trendchange in the output of the DTI ...

    e.g.

    x=3,5 - x=4,7 - x=6,8 -> x= 5,7 (5,7 < 6,8 =>so there is a Trendchange)

    can anybody tell me how to realize this (because i think in the formula wizzard there is no way to get such things done ... (correct me if there is a way in the formula wizzard))

    thanks and regards erilein

  • #2
    Eric
    What is the DTI?
    Alex

    Comment


    • #3
      that isnt a standartformula i dont know my daddy downloaded it a few month ago ... its called dirrectional trend index
      regards eric
      Last edited by erilein; 11-03-2003, 11:16 AM.

      Comment


      • #4
        i got the file and attached it...
        regards eric
        Attached Files

        Comment


        • #5
          Eric
          The attached revision should do what you asked
          Alex

          Attached Files

          Comment


          • #6
            can you tell me please what this code snippet does exactly ?
            so i learn coding a little bit

            if(getBarState()==BARSTATE_NEWBAR){
            BarCntr += 1;
            }
            if (BarCntr > 14) {
            var vRef = ref(-1);
            var DTIx = vRef[0];
            }

            if(DTI>DTIx){
            setBarFgColor(Color.green);
            }
            if(DTI<DTIx){
            setBarFgColor(Color.red);
            }
            you attached only this right ???
            and i have got another question how do i change the background color in the main chartwindow ?
            regards and much thanks ... erilein

            Comment


            • #7
              Eric
              There is also a var BarCntr = 0; before function main().
              For explanation of this snippet of code and more examples look in Chris Kryza EFS Help Files under ref()
              As to the background color you cannot change it in the price pane based on this efs if you are plotting the efs in its own window. You can only change the color of the price bars.
              Alex

              Comment


              • #8
                ok... thank you.
                but signals will be working with this formula ?
                rgards erilein

                Comment


                • #9
                  Eric
                  Depends what you mean by signals. If you mean trading signals like doLong, doShort, etc then yes. If instead you mean plotting shapes or lines or text in the price pane then no for the same reason as with background color.
                  Alex

                  Comment


                  • #10
                    yes i mean trading signals but also alerts ... but i think when the trading signals will be working the alerts will do too ...
                    regards eric

                    Comment


                    • #11
                      Eric
                      You should have no problems adding alerts to the trading functions.
                      Alex

                      Comment


                      • #12
                        Dear Alex,

                        When using dti(2).efs, I repeatedly receive an error message concerning line 91 (see attachment). Could you please effect a fix?

                        Many thanks,

                        jrbarr
                        Attached Files

                        Comment


                        • #13
                          jrbarr
                          Seems to be working fine here.
                          Can you provide a symbol, interval or indicate under what condition(s) you are getting the error.
                          Alex

                          Comment


                          • #14
                            Hi Alex,

                            The sole condition under which the error occurs is as follows: When I'm moving a chart back in time, the chart data freezes (i.e., disappears) while it's pulling in more data. When the status bar changes from "Request Sent" to "Receiving" and back to "OK" and all the data reappears, every study will refresh itself except for DTI, and that's exactly when the error message appears. I have to manually reload DTI, then it will correct itself and reappear along with the current chart data.

                            This occurs with equities and futures contracts.

                            Thanks,

                            jrbarr

                            Comment


                            • #15
                              jrbarr
                              I think I have found the cause of this issue and the attached revision should fix it
                              Alex
                              Attached Files

                              Comment

                              Working...
                              X