Announcement

Collapse
No announcement yet.

EFS Studies

Collapse
This topic is closed.
X
X
 
  • Filter
  • Time
  • Show
Clear All
new posts

  • #76
    New EFS Study ##

    Averages > MFI - Money Flow Indicator (Chaikin) [eSignal EFS Indicators]

    Download:


    Category: Oscillators

    Description:

    Indicator plots Money Flow Indicator (Chaikin). This indicator looks to improve on Larry William's Accumulation Distribution formula that compared the closing price with the opening price. In the early 1970's, opening prices for stocks stopped being transmitted by the exchanges. This made it difficult to calculate Williams' formula. The Chaikin Oscillator uses the average price of the bar calculated as follows (High + Low) /2 instead of the Open.

    The indicator subtracts a 10 period exponential moving average of the AccumDist function from a 3 period exponential moving average of the AccumDist function.
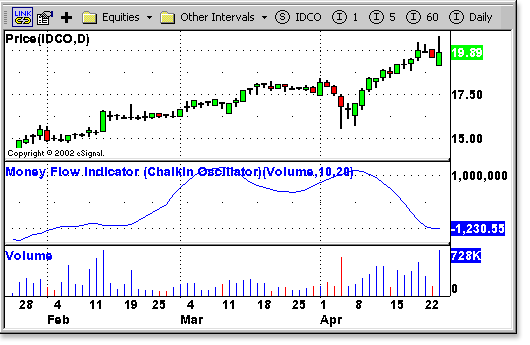


    Inputs:

    MyVol - the volume of the day
    Slow - period used to calculate the fast exponential moving average
    Fast - period used to calculate the slow exponential moving average

    EFS Code:

    Code:
    /*******************************************************************
    Description	: This Indicator plots Money Flow Indicator
    Provided By	: Developed by TS Support, LLC for eSignal. (c) Copyright 2002
    ********************************************************************/
    
    function preMain()
    {
        setStudyTitle("Money Flow Indicator (Chaikin Oscillator)"); 
        setCursorLabelName("Chaikin Oscillator");
    }
    
    var XA1_1 = 0.0;
    var XA2_1 = 0.0;
        
    
    function main(MyVol,Fast,Slow)
    {
        var myVol = "Volume";
        if (MyVol != null) myVol = MyVol;
        var fast = 3;
        if (Fast != null) fast = Fast;
        var slow = 13;
        if (Slow != null) slow = Slow;
        var AD =0;
        var lenMax = Math.max(fast,slow);
        var lenMin = Math.min(fast,slow);
        var i = 0;
        var j = 0;
        var SumMax = 0.0;
        var SumMin = 0.0;
        var Div = 0.0;
        var XA1 = 0.0;
        var XA2 = 0.0;
        var Vol = 0.0;
        var vVolume = getValue("Volume",0,-lenMax);
        var vHigh = getValue("High",0,-lenMax);
        var vLow = getValue("Low",0,-lenMax);
        var vOpen = getValue("Open",0,-lenMax);
        var vClose = getValue("Close",0,-lenMax);
        for (i = (lenMax - 1);i >= 0;i--)
        {
            Vol = vVolume[i];
            Div = (vHigh[i] - vLow[i]) * Vol;
            if (Div > 0)
            {
                SumMax += (vClose[i] - vOpen[i])/(vHigh[i] - vLow[i])*Vol; 
                if (i < lenMin) 
                {
                    SumMin += (vClose[i] - vOpen[i])/(vHigh[i] - vLow[i])*Vol;
                }
            }        
        }
        var FactorMax = 2 / (lenMax + 1);
        var FactorMin = 2 / (lenMin + 1);
        if (lenMax == slow)
        {
            if (XA1_1 == 0.0)
            {
                XA1 = SumMax;
                XA2 = SumMin;
            }
            else
            {
                XA1 = FactorMax * SumMax + (1 - FactorMax) * XA1_1;
                XA2 = FactorMin * SumMin + (1 - FactorMin) * XA2_1;
            }
        }
        else
        {
            if (XA1_1 == 0.0)
            {
                XA1 = SumMin;
                XA2 = SumMax;
            }
            else
            {
                XA2 = FactorMax * SumMax + (1 - FactorMax) * XA1_1;
                XA1 = FactorMin * SumMin + (1 - FactorMin) * XA2_1;
            }
        }
        var res = (XA1 - XA2);
        if (getBarState() == BARSTATE_NEWBAR)
        {
            XA1_1 = XA1;
            XA2_1 = XA2;
        }
        return res;
    }

    Comment


    • #77
      Re: New EFS Study # 19

      Perhaps I am mistaken but it looks to me that when the PFE is above ZERO the price is going down and vice versa... am I seeing something inaccurately?

      I am NOT familiar with PFE.. but I am curious to learn.


      Originally posted by TS Support
      Averages > PFE (Polarized Fractal Efficiency) [eSignal EFS Indicators]

      Download:


      Category: Fractals

      Description:

      The Polarized Fractal Efficiency (PFE) indicator measures the efficiency of price movements by drawing on concepts from fractal geometry and chaos theory. The more linear and efficient the price movement, the shorter the distance the prices must travel between two points and thus the more efficient the price movement.

      The PFE indicator measures how trendy or congested the price action is. PFE readings above zero indicate that the trend is up. The higher the reading the "trendier" and more efficient the upward movement. PFE readings below zero mean that the trend is down. The lower the reading the "trendier" and more efficient the downward movement. Readings near zero indicate choppy, less efficient movement, with a balance between the forces of supply and demand. StockSpotter uses a short-term smoothed PFE with an intermediate lookback interval and produces buy/sell signals based on PFE threshold crossings.


      No Inputs

      EFS Code:

      Code:
      /*******************************************************************
      Description	: This Indicator plots PFE (Polarized Fractal Efficiency) indicator
      Provided By	: Developed by TS Support, LLC for eSignal. (c) Copyright 2002 
      ********************************************************************/
      
      function preMain()
      {
          setStudyTitle("Polarized Fractal Efficiency");
          setCursorLabelName("EMA", 0);
          setCursorLabelName("BUYZONE", 1);
          setCursorLabelName("SELLZONE", 2);
          setDefaultBarFgColor(Color.aqua, 0);
          setDefaultBarFgColor(Color.blue, 1);
          setDefaultBarFgColor(Color.red, 2);
      }
      var First = true;
      var EMA = 0.0;
      
      var EMA_1 = 0.0;
      function main()
      {
          var PFE = 0.0;
          var C2C = 0.0;
          var Counter = 0;
          var FracEff = 0.0;
          var Close = getValue("Close", 0, -10);
          PFE = Math.sqrt(Math.pow((Close[0] - Close[9]),2) + 100);
          for (Counter = 1; Counter < 10; Counter++)
          {
              C2C += Math.sqrt(Math.pow((Close[Counter - 1] - Close[Counter]), 2) + 1);
          }
          if ((Close[0] - Close[9]) > 0) FracEff = Math.round((PFE / C2C) * 100);
          else FracEff = Math.round(-(PFE / C2C) * 100);
          if (First)
          {
              EMA = FracEff;
              First = false;
          }
          else EMA = Math.round(FracEff * 0.333 + EMA_1 * (1 - 0.333));
          if (getBarState() == BARSTATE_NEWBAR) EMA_1 = EMA;
          return new Array(EMA, 50, -50);
      }

      Comment


      • #78
        I haevn't run his copy of PFE, but what it should do is measure the efficency of a move. The theory is that any one specific market or stock will have its own unique threshold for how effiecent a move it can make. It might turn before this level is reached, but once the peak/valley is reached the markets are due for a reversal.
        Garth

        Comment


        • #79
          EFS Study # 17

          Oscillators > Reverse Engineering RSI [eSignal EFS Indicators]

          Download:


          Category: Oscillators

          Description:

          Reverse engineering is a mathematical procedure that takes the inverse of an oscillator. The reverse-engineered RSI, or RevEngRSI for short, can help determine the following time period’s closing price using the value of the oscillator.

          To define the RSI of k periods for a daily graph, it is necessary to first define the up-close and down-close indicators (UC and DC) for the day n. These are as follows:

          UC(n) = C(n) - C(n-1), if C(n) > C(n-1)
          UC(n) = 0, if C(n) <= C(n-1)

          DC(n) = C(n-1) - C(n), if C(n-1) > C(n)
          DC(n) = 0, if C(n-1) <= C(n),

          where C(n) & C(n-1) are the closing prices for the days n & n-1.

          In the sequence, the average up close of k periods [AUC(k)] is defined to be the (2k–1)-period exponential moving average of UC. The average down close of k periods [ADC(k)] is the (2k–1)-period exponential moving average of DC. The RSI of k periods for day n then is:

          RSI(k)n = (1-(1/(1+AUC(k)n/ADC(k)n))).

          Before moving on to the formula, we should note that the possible values of one-day closing prices and the corresponding RSI values are in one-to-one correspondence. Suppose that today’s closing price for an equity is C0 and the value of RSI for today is RSI0. If you know "a priori" the value of RSI for tomorrow (and this value is RSI1), then you are able to find the closing price for tomorrow. Moreover, if RSI1>RSI0 you can expect C1>C0, and if RSI1<RSI0, you can expect C1<C0. The reverse engineering tactic can be applied to all oscillators if the value depends upon one and only one parameter (high, low, close, open, or volume). For the highest accuracy, it should only be used for the next price projection.

          Let C0, RSI0, AUC0, and ADC0 be the values of today’s closing price, RSI, AUC, and ADC. Let C1 and RSI1 be the values of tomorrow’s closing price and RSI. All of these values are known except C1, which is what trader is seeking.

          X is define to be:

          X = (k-1) [ADC0 (RSI1/(100-RSI1)) - AUC0]

          The value of C1 is:

          C1 = C0 + X, if X >= 0

          C1 = C0 + X ((100-RSI1)/RSI1), if x < 0.

          The methods presented in this article are supplementary to other methods. After identifying where the market is likely to move, you may want to see which are the possible levels or what the most extreme scenario is for the next close. The reverse engineering of RSI should be considered only for the next day’s (week’s, month’s, and so on) movement of the market for highest accuracy, because there are numerous variations of two or more market movements that can push RSI into a specific value. With only one movement, the market can push the RSI to a specific value only by one way, giving you an exact price projection. This is especially true when using the trendline and moving average support-resistance levels.

          The reverse engineering process cannot be used for complex indicators with more than one parameter (such as stochastics) because there would be more than one unknown variable. If you use the reverse engineering method of RSI to project a closing price that needs more than one movement of the market to push the RSI to a specific level, then the accuracy will be low. Moreover, the more movements the market requires to push the RSI to the projected level, the lower the accuracy of the projection for the closing price.


          Inputs:

          value - RSI Value
          WildPer - Wilder Time Periods

          EFS Code:

          Code:
          /*******************************************************************
          Description	: This Indicator plots the Reverse Engineering RSI
          Provided By	: TS Support, LLC for eSignal
          ********************************************************************/
          
          function preMain(){
          	setPriceStudy(true);
          	setStudyTitle("Reverse Engineering RSI");
          	setCursorLabelName("RSI",0);
          	setDefaultBarFgColor(Color.red,0);
          }
          
          var AUC_1 = 0;
          var ADC_1 = 0;
          
          function main(value,WildPer){
          	if(value == null)
          		value = 50;
          	if(WildPer == null)
          		WildPer = 14;
          	
          	ExpPer = 2 * WildPer - 1;
          	K = 2 / (ExpPer + 1);
          	
          	if(close() > close(-1)){
          		AUC = K * (close() - close(-1)) + (1 - K) * AUC_1;
          		ADC = (1 - K) * ADC_1;
          	}	
          	else {
          		AUC = (1 - K) * AUC_1;
          		ADC = K * (close(-1) - close()) + (1 - K) * ADC_1;
          	}
          	
          		
          	x = (WildPer - 1) * (ADC * value / (100 - value) - AUC);
          	
          	if(x >= 0)
          		RevEngRSI = close() + x;
          	else
          		RevEngRSI = close + x * (100 - value) / value;
          	
          	if (getBarState() == BARSTATE_NEWBAR){
          		AUC_1 = AUC;
          		ADC_1 = ADC;
          	}
          		
          	return RevEngRSI;
          }
          Last edited by TS Support; 05-15-2003, 03:30 AM.

          Comment


          • #80
            What happened?

            I changed the RSI value from 14 to 2 and the line doesn't display....

            Can you please help?
            Attached Files

            Comment


            • #81
              EFS Study #18

              Averages > MFI - Money Flow Indicator (Chaikin) [eSignal EFS Indicators]

              Download:


              Category: Oscillators

              Description:

              Indicator plots Money Flow Indicator (Chaikin). This indicator looks to improve on Larry William's Accumulation Distribution formula that compared the closing price with the opening price. In the early 1970's, opening prices for stocks stopped being transmitted by the exchanges. This made it difficult to calculate Williams' formula. The Chaikin Oscillator uses the average price of the bar calculated as follows (High + Low) /2 instead of the Open.
              The indicator subtracts a 10 period exponential moving average of the AccumDist function from a 3 period exponential moving average of the AccumDist function.

              The most important signal generated by the Chaikin Oscillator occurs when prices reach a new high or new low for a swing, particularly at an overbought or oversold level, and the oscillator fails to exceed its previous extreme reading and then reverses direction.
              1. Signals in the direction of the intermediate-term trend are more reliable than those against the trend.
              2. A confirmed high or low does not imply any further price action in that direction. I view that as a non-event.
              A second way to use the Chaikin Oscillator is to view a change of direction in the oscillator as a buy or sell signal, but only in the direction of the trend. For example, if we say that a stock that is above its 90-day moving average of price is in an uptrend, then an upturn of the oscillator while in negative territory would constitute a buy signal only if the stock were above its 90-day moving average - not below it.
              A downturn of the oscillator while in positive territory (above zero) would be a sell signal if the stock were below its 90-day moving average of closing prices.


              Inputs:

              MyVol - the volume of the day
              Slow - period used to calculate the fast exponential moving average
              Fast - period used to calculate the slow exponential moving average

              EFS Code:

              Code:
              /*******************************************************************
              Description	: This Indicator plots Money Flow Indicator
              Provided By	: Developed by TS Support, LLC for eSignal. (c) Copyright 2002
              ********************************************************************/
              
              
              function preMain()
              {
                  setStudyTitle("Money Flow Indicator (Chaikin Oscillator)"); 
                  setCursorLabelName("Chaikin Oscillator");
              }
              
              var XA1_1 = 0.0;
              var XA2_1 = 0.0;
                  
              
              function main(MyVol,Fast,Slow)
              {
                  var myVol = "Volume";
                  if (MyVol != null) myVol = MyVol;
                  var fast = 3;
                  if (Fast != null) fast = Fast;
                  var slow = 13;
                  if (Slow != null) slow = Slow;
                  var AD =0;
                  var lenMax = Math.max(fast,slow);
                  var lenMin = Math.min(fast,slow);
                  var i = 0;
                  var j = 0;
                  var SumMax = 0.0;
                  var SumMin = 0.0;
                  var Div = 0.0;
                  var XA1 = 0.0;
                  var XA2 = 0.0;
                  var Vol = 0.0;
                  var vVolume = getValue("Volume",0,-lenMax);
                  var vHigh = getValue("High",0,-lenMax);
                  var vLow = getValue("Low",0,-lenMax);
                  var vOpen = getValue("Open",0,-lenMax);
                  var vClose = getValue("Close",0,-lenMax);
                  for (i = (lenMax - 1);i >= 0;i--)
                  {
                      Vol = vVolume[i];
                      Div = (vHigh[i] - vLow[i]) * Vol;
                      if (Div > 0)
                      {
                          SumMax += (vClose[i] - vOpen[i])/(vHigh[i] - vLow[i])*Vol; 
                          if (i < lenMin) 
                          {
                              SumMin += (vClose[i] - vOpen[i])/(vHigh[i] - vLow[i])*Vol;
                          }
                      }        
                  }
                  var FactorMax = 2 / (lenMax + 1);
                  var FactorMin = 2 / (lenMin + 1);
                  if (lenMax == slow)
                  {
                      if (XA1_1 == 0.0)
                      {
                          XA1 = SumMax;
                          XA2 = SumMin;
                      }
                      else
                      {
                          XA1 = FactorMax * SumMax + (1 - FactorMax) * XA1_1;
                          XA2 = FactorMin * SumMin + (1 - FactorMin) * XA2_1;
                      }
                  }
                  else
                  {
                      if (XA1_1 == 0.0)
                      {
                          XA1 = SumMin;
                          XA2 = SumMax;
                      }
                      else
                      {
                          XA2 = FactorMax * SumMax + (1 - FactorMax) * XA1_1;
                          XA1 = FactorMin * SumMin + (1 - FactorMin) * XA2_1;
                      }
                  }
                  var res = (XA1 - XA2);
                  if (getBarState() == BARSTATE_NEWBAR)
                  {
                      XA1_1 = XA1;
                      XA2_1 = XA2;
                  }
                  return res;
              }

              Comment


              • #82
                EFS Study #19

                Averages > RSI Enhanced [eSignal EFS Indicators]

                Download:


                Category: Oscillators

                Description:

                This is the enhanced version of RSI. The Relative Strength Index ("RSI") is a popular oscillator. It was first introduced by Welles Wilder in an article in Commodities (now known as Futures) Magazine in June, 1978. Step-by-step instructions on calculating and interpreting the RSI are also provided in Mr. Wilder's book, New Concepts in Technical Trading Systems.

                The name "Relative Strength Index" is slightly misleading as the RSI does not compare the relative strength of two securities, but rather the internal strength of a single security. A more appropriate name might be "Internal Strength Index." Relative strength charts that compare two market indices, which are often referred to as Comparative Relative Strength.


                Inputs:

                Length - number of bars to calculate

                EFS Code:

                Code:
                /******************************************************************************************
                Description: This Indicator plots RSI Enhanced indicator 
                Provided By: eSignal, a division of Interactive Data Corporation. Copyright ¿ 2002   
                ******************************************************************************************/
                
                function preMain() {
                	setStudyMin(0);
                	setStudyMax(100);
                }
                
                // these variables stay "alive" between calls to main()
                var dSumUp = 0.0;
                var dSumDn = 0.0;
                var dAvgUp = 0.0;
                var dAvgDn = 0.0;
                var dLastAvgUp = 0.0;
                var dLastAvgDn = 0.0;
                var nCount = 0;
                
                function main(nInputLength) {
                    if(nInputLength == null)
                        nInputLength = 14;
                
                	if(nInputLength <= 2)
                		return;
                
                	var nBarState = getBarState();
                	
                	if(nBarState == BARSTATE_ALLBARS) {
                		dSumUp = 0.0;
                		dSumDn = 0.0;
                		nCount = 0;
                	}
                
                	var dClose = close(0);
                	var dPrevClose = close(-1);
                
                	if(dClose == null || dPrevClose == null)
                		return;
                
                	var dDiff = dClose - dPrevClose;
                
                	var dUp = 0, dDn = 0;
                
                	if(dDiff >= 0) {
                		dUp = dDiff;
                	} else {
                		dDn = dDiff * -1.0;
                	}
                
                	if(nCount < nInputLength) {
                		dSumUp += dUp;
                		dSumDn += dDn;
                		nCount++;
                		return;
                	} else if(nCount == nInputLength) {
                		nCount++;
                		dAvgUp = dSumUp / nInputLength;
                		dAvgDn = dSumDn / nInputLength;
                	} else {
                		if(nBarState == BARSTATE_NEWBAR) {
                			dLastAvgUp = dAvgUp;
                			dLastAvgDn = dAvgDn;
                		} else if(nBarState == BARSTATE_CURRENTBAR) {
                		}
                
                		dAvgUp = (dLastAvgUp*(nInputLength-1) + dUp)/ nInputLength;
                		dAvgDn = (dLastAvgDn*(nInputLength-1) + dDn)/ nInputLength;
                	}
                
                	var dSum = dAvgUp + dAvgDn;
                	var dRS = 0.0;
                
                	if(dSum != 0.0) {
                		dRS = (dAvgUp / dSum) * 100.0;
                	}
                
                	return dRS;
                }

                Comment


                • #83
                  EFS Study

                  Averages > EMA with Reference [eSignal EFS Indicators]

                  Download:


                  Category: Oscillators

                  Description:

                  In order to reduce the lag in simple moving averages, technicians sometimes use exponential moving averages, or exponentially weighted moving averages. Exponential moving averages reduce the lag by applying more weight to recent prices relative to older prices. The weighting applied to the most recent price depends on the length of the moving average. The shorter the exponential moving average is, the more weight that will be applied to the most recent price. For example: a 10-period exponential moving average weighs the most recent price 18.18% and a 20-period exponential moving average weighs the most recent price 9.52%. The method for calculating the exponential moving average is fairly complicated. The important thing to remember is that the exponential moving average puts more weight on recent prices. As such, it will react quicker to recent price changes than a simple moving average. For those who wish to see an example formula for an exponential moving average, one is provided below. Others may prefer to skip this section and move on the comparison of the moving averages.

                  Exponential Moving Average is calculated according to this formula:


                  X = (K x (C - P)) + P, where:


                  X = Current EMA
                  C = Current Price
                  P = Previous period's EMA*
                  K = Smoothing constant
                  (*A SMA is used for first period's calculation)

                  The smoothing constant applies the appropriate weighting to the most recent price relative to the previous exponential moving average. The formula for the smoothing constant is:

                  K = 2/(1+N)
                  N = Number of periods for EMA

                  Usage:

                  There are 2 basic uses for moving averages: Trend identification/confirmation and Support&Resistance level identification/confirmation

                  Trend Identification/Confirmation:

                  There are three ways to identify the direction of the trend with moving averages: direction, location and crossovers.

                  The first trend identification technique uses the direction of the moving average to determine the trend. If the moving average is rising, the trend is considered up. If the moving average is declining, the trend is considered down. The direction of a moving average can be determined simply by looking at a plot of the moving average or by applying an indicator to the moving average. In either case, we would not want to act on every subtle change, but rather look at general directional movement and changes.

                  The second technique for trend identification is price location. The location of the price relative to the moving average can be used to determine the basic trend. If the price is above the moving average, the trend is considered up. If the price is below the moving average, the trend is considered down.

                  The third technique for trend identification is based on the location of the shorter moving average relative to the longer moving average. If the shorter moving average is above the longer moving average, the trend is considered up. If the shorter moving average is below the longer moving average, the trend is considered down.

                  Support and Resistance Levels:

                  Another use of moving averages is to identify support and resistance levels. This is usually accomplished with one moving average and is based on historical precedent. As with trend identification, support and resistance level identification through moving averages works best in trending markets.


                  Inputs:

                  Length - number of bars to use in calculation

                  EFS Code:

                  Code:
                  /******************************************************************************************
                  Description: This Indicator plots EMA with Reference indicator
                  Provided By: eSignal, a division of Interactive Data Corporation. Copyright © 2002   
                  ******************************************************************************************/
                  function preMain() {
                      setPriceStudy(true);
                  }
                  
                  var dPercent = 0.0;
                  var bPrimed = false;
                  
                  
                  function main(nInputLength) {
                      if(nInputLength == null)
                          nInputLength = 50;
                  
                  	var nBarState = getBarState();
                      var i;
                  	var dValue;
                  	var dSum = 0.0;
                  	var dRef;
                  
                  	if(nBarState == BARSTATE_ALLBARS) {
                  		dPercent = (2.0 / (nInputLength + 1.0));
                  		bPrimed = false;
                  	}
                  
                  	if(bPrimed == false) {
                  	    dValue = getValue("Close", 0, -nInputLength);
                  		if(dValue == null)
                  			return;
                  
                  	    for(i = 0; i < nInputLength; i++) {
                  		    dSum += dValue[i];
                  	    }
                  
                  		bPrimed = true;
                  		return dSum / nInputLength;
                  	} else {
                  		dValue = getValue("Close");
                  		dRef = ref(-1);
                  		if(dValue == null || dRef == null)
                  			return;
                  
                  		return (dValue - dRef) * dPercent + dRef;
                  	}
                  }

                  Comment


                  • #84
                    Alerts

                    Is there alerts for indicators such as slow k crossing over or below oversold/ overbought?


                    thanks

                    Comment


                    • #85
                      vcam6
                      I don't know if there are any already coded. Irrespective you should try using the Formula Wizard as it makes creating efs such as the one you want a very easy task.
                      Alex

                      Comment


                      • #86
                        EFS Study ##

                        Averages > Kaufman Moving Average Adaptive (KAMA) [eSignal EFS Indicators]

                        Download:


                        Category: Averages

                        Description:

                        Everyone wants a short-term, fast trading trend that works without large losses. That combination does not exist. But it is possible to have fast trading trends in which one must get in or out of the market quickly, but these have the distinct disadvantage of being whipsawed by market noise when the market is volatile in a sideways trending market. During these periods, the trader is jumping in and out of positions with no profit-making trend in sight. In an attempt to overcome the problem of noise and still be able to get closer to the actual change of the trend, Kaufman developed an indicator that adapts to market movement. This indicator, an adaptive moving average (AMA), moves very slowly when markets are moving sideways but moves swiftly when the markets also move swiftly, change directions or break out of a trading range.

                        Usage:

                        AMA is using the efficiency ratio to adjust the speed of the moving average. In order to construct the AMA, many different qualities of the market must be known. First is the price direction, or the net price change over n days. This is the difference between the price today and the price n days ago. Kaufman uses n of 10 days in Smarter Trading: Direction = Price – price (n).


                        Inputs:

                        Length - number of bars to use in calculation

                        EFS Code:

                        Code:
                        /*******************************************************************
                        Description	: This Indicator plots KAMA Indicator
                        Provided By	: Developed by TS Support, LLC for eSignal. (c) Copyright 2002
                        ********************************************************************/
                        
                        function preMain()
                        {
                            setStudyTitle("KAMA");
                            setCursorLabelName("KAMA", 0);
                            setDefaultBarFgColor(Color.red, 0);
                            setPriceStudy(true);
                        }
                        
                        vnoise = new Array();
                        var AMA_1 = 0;
                        
                        function main(period) {
                        	if (period == null) 
                        		period = 21;
                        	var i;		
                        	var efratio = 1;
                        	var AMA = 0;
                        	var fastend = .666;
                        	var slowend = .0645;
                        	var noise = 0;
                        	var signal = 0;
                        	var smooth = 0;
                        	var diff = 0;
                        	
                        	diff = Math.abs(close() - close(-1));
                        	if (getBarState() == BARSTATE_NEWBAR){
                        		for(i = period - 1; i > 0; i--)
                        				vnoise[i] = vnoise[i - 1];
                        		vnoise[0] = diff;
                        	}
                        	if(getCurrentBarIndex() - getOldestBarIndex() > period){
                        		signal = Math.abs(close() - close(-period));
                        		for(i = 0; i < period; i++)
                        			noise += vnoise[i];
                        		if(noise != 0)
                        			efratio = signal / noise;
                        	} 
                        	if(getCurrentBarIndex() - getOldestBarIndex() <= period)
                        		AMA = close();
                        	smooth = Math.pow(efratio * (fastend - slowend) + slowend,2); 
                        	AMA = AMA_1 + smooth * (close() - AMA_1);
                        	if (getBarState() == BARSTATE_NEWBAR)
                        		AMA_1 = AMA;
                        	return AMA;
                        }

                        Comment


                        • #87
                          Can the Kaufman Adaptive Moving Average be revised so it is colored as follows:

                          blue - when trending up
                          red - when trending down
                          grey - when flat or sideways

                          It would greatly help.

                          I trade the ZB (Bonds) using a 1min chart, and I find that when there are more than 3 bars with the same KAMA value, it is a sideways choppy market.

                          Thanks.

                          Comment


                          • #88
                            #EFS Study - Bill Williams Averages. Alligator

                            Averages > Bill Williams Averages. Alligator [eSignal EFS Indicators]

                            Download:


                            Category: Averages

                            Description:

                            The 1st 2 chapters are somewhat of ramble where the author describes the "metaphysics" of trading. Still some good ideas are offered. The book references chaos theory, and leaves it up to the reader to believe whether "supercomputers" were used in formulating the various trading methods (the author wants to come across as an applied mathemetician, but he sure looks like a stock trader).

                            There isn't any obvious connection with Chaos Theory - but despite of the weak link between the title and content, the trading methodologies do work. Most readers consider the author's systems to be a perfect filter and trigger for a short term trading system. He states a goal of 10%/month, but when these filters & axioms are correctly combined with a good momentum system, much more is a probable result.

                            There's better written & more informative books out there for less money, but this author does have the "Holy Grail" of stock trading. A set of filters, axioms, and methods which are the "missing link" for any trading system which is based upon conventional indicators.

                            This indicator calculates 3 Moving Averages for 21, 13 and 8 days, with displacement 8, 5 and 3 days: Median Price (High+Low/2).

                            The most popular method of interpreting a moving average is to compare the relationship between a moving average of the security's price with the security's price itself (or between several moving averages).


                            No Inputs

                            EFS Code:

                            Code:
                            /*******************************************************************
                            Description	: This Indicator plots Bill Williams Averages. Alligator
                            Provided By	: Developed by TS Support, LLC for eSignal. (c) Copyright 2002 
                            ********************************************************************/
                            
                            function preMain()
                            {
                                setPriceStudy(true);
                                
                                setStudyTitle("Alligator");
                            
                                setCursorLabelName("Plot1", 0);
                                setCursorLabelName("Plot2", 1);
                                setCursorLabelName("Plot3", 2);
                            
                                setDefaultBarFgColor(Color.blue, 0);
                            	setDefaultBarFgColor(Color.red, 1); 
                            	setDefaultBarFgColor(Color.green, 2);
                            }
                            var XA1_1 = 0.0;
                            var XA2_1 = 0.0;
                            var XA3_1 = 0.0;
                            function main()
                            {
                                var BarState = getBarState();
                                var vHigh = getValue("High", 0, -30);
                                var vLow = getValue("Low", 0, - 30);
                                var MedianPrice = (vHigh[8] + vLow[8]) / 2;
                                var Factor = 2 / 22;
                                var XA1 = Factor * MedianPrice + (1 - Factor) * XA1_1;
                                if (BarState == BARSTATE_NEWBAR) XA1_1 = XA1;
                                Facotor = 2 / 14;
                                MedianPrice = (vHigh[5] + vLow[5]) / 2;
                                var XA2 = Factor * MedianPrice + (1 - Factor) * XA2_1;
                                if (BarState == BARSTATE_NEWBAR) XA2_1 = XA2;
                                Facotor = 2 / 9;
                                MedianPrice = (vHigh[3] + vLow[3]) / 2;
                                var XA3 = Factor * MedianPrice + (1 - Factor) * XA3_1;
                                if (BarState == BARSTATE_NEWBAR) XA3_1 = XA3;
                                return new Array(XA1, XA2, XA3);
                            }

                            Comment


                            • #89
                              Its late, I am fried . . .

                              Alright, I have a question for anyone out there smarted than I am right now, and I have been racking my brain and I know the answer is easy, but I can not find it anywhere.

                              These studies return a value, much like the normal studies that I load which come with E-Signal. How do I call the returned values from the TSS Support group in my own personal EFS?

                              In specific, how do I declare the study, and call the returned variable from the EFS into each loop of my own study? For instance, with a standard EFS I might do this:

                              var study1 = new RSIStudy(14, "Close");

                              and then . . .

                              var myRSI = study1.getValue(RSIStudy.RSI);

                              If anyone can help I will appreciate it.

                              Thomas.

                              Comment


                              • #90
                                Hi Thomas,

                                If I understand you correctly then you can use the callFunction()
                                method. http://www.esignalcentral.com/traini...ons/hs240.htm. Please let me know how I could be of a further help.

                                Regards,
                                Andy

                                Comment

                                Working...
                                X