Announcement

Collapse
No announcement yet.

EFS Studies

Collapse
This topic is closed.
X
X
 
  • Filter
  • Time
  • Show
Clear All
new posts

  • #91
    Link not found . . .

    Hey Andy,

    Thanks for your immediate response, I truly appreciate it. The link you gave me is dead, so maybe you can try that again sometime. But as a better explanation, and being fresh in the morning, this is what I need to do. This is such a good piece of functionality, that I think a good discussion will help others.

    So I have my personal EFS, that I have loaded with all these other pieces of code and some standard stuff that makes or breaks my strategy. When I use standard E-Sig studies, I just load them in the chart, and call them in the EFS as such:

    DECLARATION:
    var study1 = new RSIStudy(14, "Close");

    OBTAIN VALUE:
    var myRSI = study1.getValue(RSIStudy.RSI);

    This I am fine with. Now comes some choice piece of code from TSS that I feel is going to help my efforts, for instance:

    function preMain()
    {
    setStudyTitle("Ergotic_MDI (Mean Deviation Indicator)");
    setCursorLabelName("ErgMDI", 0);
    setCursorLabelName("SigLin", 1);
    setCursorLabelName("ZeroLine", 2);
    setDefaultBarFgColor(Color.fushcia, 0);
    setDefaultBarFgColor(Color.grey, 1);
    setDefaultBarFgColor(Color.cyan, 2);
    }
    var XA1_1 = 0.0;
    var XA2_1 = 0.0;
    var XA3_1 = 0.0;
    var XA4_1 = 0.0;

    function main(r, s, u, ZeroLine)
    {
    if (r == null) r = 32;
    if (s == null) s = 5;
    if (u == null) u = 5;
    if (ZeroLine == null) ZeroLine = 0;
    var FactorR = 2 / (r + 1);
    var FactorS = 2 / (s + 1);
    var FactorU = 2 / (u + 1);
    var Close = close(0);
    var XA1 = FactorR * Close + (1 - FactorR) * XA1_1;
    var XA2 = FactorS * (Close - XA1) + (1 - FactorS) * XA2_1;
    var XA3 = FactorU * XA2 + (1 - FactorU) * XA3_1;
    var XA4 = FactorU * XA3 + (1 - FactorU) * XA4_1;
    if (getBarState() == BARSTATE_NEWBAR)
    {
    XA1_1 = XA1;
    XA2_1 = XA2;
    XA3_1 = XA3;
    XA4_1 = XA4;
    }
    return new Array(XA3, XA4, ZeroLine);
    }

    So this is what I understand. I need to use the call() function, I need to place this EFS in my E-Sig Doc Root Directory, but what I do not understand is how to translate the actual calls.

    I know that:

    return new Array(XA3, XA4, ZeroLine);

    returns values in the EFS through the main() by:

    function main(r, s, u, ZeroLine)

    My only major missing piece, is how to substitute the commands:

    DECLARATION:
    var study1 = new RSIStudy(14, "Close");

    OBTAIN VALUE:
    var myRSI = study1.getValue(RSIStudy.RSI);

    with equivalent commands, when I am using a custom study? So how do I call the values returned by r, s, and u from main in my own study.

    I appreciate any help on this, it is so key in my understanding of what I am doing right now, so I want to make sure I get it right.

    Thanks,

    Thomas.
    Comment


    • #92
      Thomas,


      Either I'm not understanding what you are trying to say, or you have a misunderstanding of how call() and callfunction() work.

      return new Array(XA3, XA4, ZeroLine);

      returns values in the EFS through the main() by:

      function main(r, s, u, ZeroLine)
      When you use callFunction("<path and name of EFS>", "<function_name>"[parameter]) it would look like this:

      nReturnValue = callFunction("MyEFSStudies\Ergotic_MDI.efs", "main", 32, 5, 5, 0);

      The above assumes that you have this efs in the MyEFSStudies subdirectory of eSignal/Formulas, and that you want all the values set to the default (you wouldn't really need to set them in that case, but this is an example).

      nReturnValue will then be an array with three values : XA3, XA4, ZeroLine

      You could get at these values as you would any array nReturnValue[0] = XA3, etc...

      Does this answer the question?

      Garth
      Garth

      Comment


      • #93
        Yep, I got it . . .

        Garth,

        It is me, I was off on the terminology, so it was hard for me to explain. But what you covered is EXACTLY what I need. I just could not understand how the returned values are accessed.

        One more thing, is nReturnedValue still declared:

        var nReturnedValue=0;

        or since it is an array, it is different?

        But THANKS SO MUCH, I really appreciate it.

        T

        Comment


        • #94
          Hi,

          var nReturnedValue=0;

          will work.

          Garth
          Garth

          Comment


          • #95
            thanks again

            you guys rock . . . thanks so much!!!

            T

            Comment


            • #96
              Re: Fix DemandIndex

              Thanks a lot for your great work on efs studies.

              However, there are some that need tweaking. One of them is the Demand
              Index - this needs to be fixed because after a few bars it goes out of wack,
              and needs to be reloaded every 6-10 minutes.

              Can somebody look into this?

              Thanks a lot.

              ----- Original Message -----
              From: <[email protected]>
              To: <[email protected]>
              Sent: Wednesday, July 23, 2003 10:55 AM
              Subject: Reply to post 'EFS Studies'


              > Hello wavetrader,
              >
              > ~~~~~~~~~~~~~~~~~~~~~~~~~~~~
              >

              Comment


              • #97
                EFS study ##

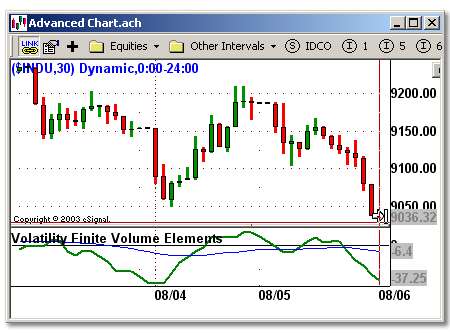
                Our next indicator is FVE (Volatility Modified).

                Volume Based > FVE (Volatility Modified) [eSignal EFS Indicators]

                Download: http://share.esignal.com/download.js...odifiedFVE.efs

                Category: Indicator > Volume Based

                Description:

                This is another version of FVE indicator that we have posted earlier in this forum.

                This version has an important enhancement to the previous one that’s especially useful with intraday minute charts.

                Due to the volatility had not been taken into account to avoid the extra complication in the formula, the previous formula has some drawbacks:

                The main drawback is that the constant cutoff coefficient will overestimate price changes in minute charts and underestimate corresponding changes in weekly or monthly charts.

                And now the indicator uses adaptive cutoff coefficient which will adjust to all time frames automatically,


                Inputs:

                Samples - number of periods to calculate FVE
                Perma - number of days to calculate MA
                Cintra - intraday volatility coefficient
                Cinter - inter-day volatility coefficient

                EFS Code:

                Code:
                /*******************************************************************
                Description	: This Indicator plots the Volatility modified FVE formula
                Provided By	: TS Support, LLC for eSignal
                ********************************************************************/
                
                function preMain(){
                    setStudyTitle("Volatility Finite Volume Elements");
                    setCursorLabelName("FVI",0);
                    setDefaultBarFgColor(Color.green,0);
                    setCursorLabelName("FVI EMA",1);
                    setDefaultBarFgColor(Color.blue,1);
                    setDefaultBarThickness(2);
                    setComputeOnClose();
                    addBand(0, PS_SOLID, 1, Color.black);
                }
                
                var EMA_1 = 0;
                VolumePlusMinusArray = new Array();
                
                function main(Samples,Perma,Cintra,Cinter){
                	if(Samples == null)
                		Samples = 22;
                	if(Perma == null)
                		Perma = 40;
                	if(Cintra == null)
                		Cintra = .1;
                	if(Cinter == null)
                		Cinter = .1;
                		
                	var TP = 0, TP1 = 0, VolumePlusMinus = 0, FVE = 0, Fvesum = 0, VolSum = 0,
                	    FveFactor = 0, Intra = 0, Inter = 0, Vintra = 0, Vinter = 0, CutOff = 0, i = 0, K = 2 / (Perma + 1), EMA = 0;
                	
                	
                	IntraArray = new Array();
                	InterArray = new Array();
                	
                	
                	for(i = 0; i < Samples; i++){
                		IntraArray[i] = Math.log(high(-i)) - Math.log(low(-i));
                		InterArray[i] = Math.log((high(-i) + low(-i) + close(-i))/3) - Math.log((high(-i-1)+ low(-i-1) + close(-i-1))/3);
                	}
                	
                	TP = (high() + low() + close())/3;
                	TP1 = (high(-1)+ low(-1) + close(-1))/3;
                	
                	Intra = Math.log(high()) - Math.log(low());
                	Vintra = StandardDev(IntraArray,Samples);
                	Inter = Math.log(TP) - Math.log(TP1);
                	Vinter = StandardDev(InterArray,Samples);
                	CutOff = Cintra * Vintra + Cinter * Vinter;	
                	MF = (close() - (high() + low())/2)+ TP - TP1;
                	
                	if(MF > CutOff * close())
                		FveFactor = 1;
                	else if(MF < -1 * CutOff * close())
                		FveFactor = -1;
                	else
                		FveFactor=0;
                		
                	
                	VolumePlusMinus = volume() * FveFactor;
                	for(i = Samples - 1; i > 0; i--)
                		VolumePlusMinusArray[i] = VolumePlusMinusArray[i - 1];
                	VolumePlusMinusArray[0] = VolumePlusMinus;
                	for(i = 0; i < Samples; i++){
                		Fvesum += VolumePlusMinusArray[i];
                		VolSum += volume(-i);
                	}
                	
                	if(VolumePlusMinusArray[Samples - 1] != null){
                		FVE = (Fvesum / VolSum) * 100;
                		EMA = K * FVE  + (1 - K) * EMA_1;
                		if (getBarState() == BARSTATE_NEWBAR)
                			EMA_1 = EMA;
                		return new Array(FVE,EMA);
                	}
                	return null;
                }
                
                function StandardDev(Array,Length){
                	var i;
                	var vSum = 0;
                	var SumSqr = 0;
                	var StdDev = 0;
                	
                	for(i = 0; i < Length; i++)
                        	vSum += Array[i];
                
                	if(Length != 0)
                		for(i = 0; i < Length; i++)
                			SumSqr += (Array[i] - vSum / Length) * (Array[i] - vSum / Length);
                
                	StdDev = Math.sqrt(SumSqr / Length);
                	return StdDev;
                }
                Last edited by TS Support; 08-06-2003, 11:24 AM.

                Comment


                • #98
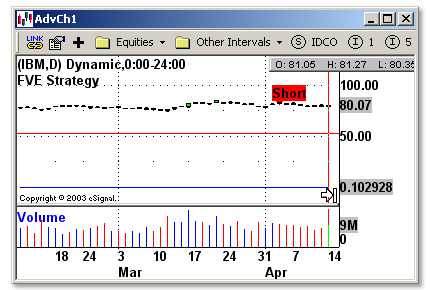
                  FVE Strategy

                  Our next study is a strategy based on FVE (Finite Volume Elements) indicator. We have posted it earlier in this thread.

                  Strategy > FVE Strategy (Finite Volume Elements) [eSignal EFS Indicators]

                  Download: http://share.esignal.com/download.js...VEStrategy.efs

                  Category: Strategy

                  Description:

                  This is a strategy based on FVE indicator that we have posted earlier in this forum.


                  Inputs:

                  Samples - number of bars to calculate FVE
                  FVEenterl - lower entry level of FVE
                  FVEenteru - upper entry level of FVE
                  MA - number of bars to calculate MA
                  LRPeriod - number of bars to calculate Lin.regression
                  Bangle - the angle to buy
                  Sangle - the angle to sell
                  LRC - number of bars to calculate Lin.regression slope
                  UB - limit for Lin. regression rising
                  LB - limit for Lin. regression falling
                  BarToExitOn - number of bars to exit position

                  EFS Code:

                  Code:
                  /*******************************************************************
                  Description	: FVE Strategy
                  Provided By	: TS Support, LLC for eSignal
                  ********************************************************************/
                  
                  /* System Testing Options:
                   * Fixed Dollars per trade: $10,000
                   * Commissions: Entry $10, Exit: $10
                   * Positions: Longs only
                   * Number of shares rounded to the nearest 10 shares
                   */
                  
                  function preMain(){
                      setStudyTitle("FVE Strategy");
                      setComputeOnClose();
                      setPriceStudy(true);
                  }
                  
                  var EMA_1 = 0;
                  VolumePlusMinusArray = new Array();
                  FVEArray = new Array();
                  BarsSinceEntry = 0;
                  
                  function main(Samples,FVEenterl,FVEenteru,MA,LRPeriod,Bangle,Sangle,LRC,UB,LB,BarToExitOn){
                  	if(Samples == null) Samples = 50;
                  	if(FVEenterl == null) FVEenterl = -20;
                  	if(FVEenteru == null) FVEenteru = 10;
                  	if(MA == null) MA = 40;
                  	if(LRPeriod == null) LRPeriod = 20;
                  	if(LRPeriod == null) LRPeriod = 20;
                  	if(Bangle == null) Bangle = 30;
                  	if(Sangle == null) Sangle = -30;
                  	if(LRC == null)	LRC = 30;
                  	if(UB == null) UB = .1;
                  	if(LB == null) LB = -.5;
                  	if(BarToExitOn == null) BarToExitOn = 70;
                  	
                  		
                  	var TP = 0, TP1 = 0, MF = 0, Cintra = .1, Cinter = .1, CutOff = 0, VolumePlusMinus = 0,
                  	     FVE = 0, Fvesum = 0, FveFactor = 0, Intra = 0, Inter = 0, Vintra = 0, Vinter = 0,
                  	     i = 0, VolSum = 0; K = 2 / (MA + 1), EMA = 0, vHL = high() - low(), vVar = vHL * 0.25,
                  	    vAddVar = vVar * 0.35, Condition1 = false, Condition2 = false, Condition3 = false, Condition4 = false, Condition5 = false;
                  		
                  	IntraArray = new Array();
                  	InterArray = new Array();
                  		
                  	for(i = 0; i < Samples; i++){
                  		IntraArray[i] = Math.log(high(-i)) - Math.log(low(-i));
                  		InterArray[i] = Math.log((high(-i) + low(-i) + close(-i))/3) - Math.log((high(-i-1)+ low(-i-1) + close(-i-1))/3);
                  	}
                  	
                  	TP = (high() + low() + close())/3;
                  	TP1 = (high(-1)+ low(-1) + close(-1))/3;
                  	
                  	Intra = Math.log(high()) - Math.log(low());
                  	Vintra = StandardDev(IntraArray,Samples);
                  	Inter = Math.log(TP) - Math.log(TP1);
                  	Vinter = StandardDev(InterArray,Samples);
                  	CutOff = Cintra * Vintra + Cinter * Vinter;	
                  	MF = (close() - (high() + low())/2)+ TP - TP1;
                  	
                  	if(MF > CutOff * close())
                  		FveFactor = 1;
                  	else if(MF < -1 * CutOff * close())
                  		FveFactor = -1;
                  	else
                  		FveFactor=0;
                  		
                  	
                  	VolumePlusMinus = volume() * FveFactor;
                  	for(i = Samples - 1; i > 0; i--)
                  		VolumePlusMinusArray[i] = VolumePlusMinusArray[i - 1];
                  	VolumePlusMinusArray[0] = VolumePlusMinus;
                  	for(i = 0; i < Samples; i++){
                  		Fvesum += VolumePlusMinusArray[i];
                  		VolSum += volume(-i);
                  	}
                  	
                  	if(VolumePlusMinusArray[Samples - 1] != null){
                  		FVE = (Fvesum / VolSum) * 100;
                  		for(i = LRPeriod - 1; i > 0; i--)
                  			FVEArray[i] = FVEArray[i - 1];
                  		FVEArray[0] = FVE;
                  		EMA = K * FVE  + (1 - K) * EMA_1;
                  		if (getBarState() == BARSTATE_NEWBAR)
                  			EMA_1 = EMA;
                  
                  	}
                  	else
                  		return null;
                  	
                  	
                  	if(FVEArray[LRPeriod - 1] != null){
                  		BarsSinceEntry++;
                  		if(FVE > FVEenterl && FVE < FVEenteru)
                  			Condition1 = true;
                  		if(LinearReg(FVEArray,LRPeriod,"AngleFC",LRC-1) > Bangle)
                  			Condition2 = true;
                  		if(FVE > EMA)
                  			Condition3 = true;
                  		if(LinearReg(close(0,-LRC),LRC,"Slope",LRC-1) < UB * LinearReg(close(0,-LRC),LRC,"Value",LRC-1) / 100 &&  LinearReg(close(0,-LRC),LRC,"Slope",LRC-1) > LB * LinearReg(close(0,-LRC),LRC,"Value",LRC-1) / 100)
                  			Condition4 = true;
                  		if(LinearReg(FVEArray,LRPeriod,"AngleFC",LRC-1) < Sangle)
                  			Condition5 = true;
                  		if(!Strategy.isInTrade()  && Condition1 && Condition2 && Condition3 && Condition4){
                  			Strategy.doLong("BUY", Strategy.CLOSE, Strategy.THISBAR);
                  			drawShapeRelative(0, low() - vVar, Shape.UPARROW, "", Color.lime, null, "buyShp" + getValue("time"));
                  			drawTextRelative(-1, low() - (vVar + vAddVar), "Buy", Color.black, Color.lime, Text.BOLD | Text.ONTOP, null, null, "buyTxt" + getValue("time"));
                  			BarsSinceEntry = 0;
                  		}
                  		if(Condition5){
                  			Strategy.doShort("FVE EXIT", Strategy.CLOSE, Strategy.THISBAR);
                  			drawShapeRelative(0, high() + vVar, Shape.DOWNARROW, "", Color.red, null, "sellShp" + getValue("time"));
                  			drawTextRelative(-1, high() + (vVar + vAddVar), "Short", Color.black, Color.red, Text.BOTTOM | Text.BOLD | Text.ONTOP, null, null, "buyTxt" + getValue("time"));
                  		}
                  		if(BarsSinceEntry == BarToExitOn){
                  			Strategy.doShort("TimeBarsLX", Strategy.CLOSE, Strategy.THISBAR);
                  			drawShapeRelative(0, high() + vVar, Shape.DOWNARROW, "", Color.red, null, "sellShp" + getValue("time"));
                  			drawTextRelative(-1, high() + (vVar + vAddVar), "Short", Color.black, Color.red, Text.BOTTOM | Text.BOLD | Text.ONTOP, null, null, "buyTxt" + getValue("time"));
                  		}
                  		return LinearReg(close(0,-LRC),LRC,"Slope",LRC-1);
                  	}
                  	else
                  		return null;
                  }


                  function StandardDev(Array,Length,Type){
                  	var i;
                  	var vSum = 0;
                  	var SumSqr = 0;
                  	var StdDev = 0;
                  	
                  	for(i = 0; i < Length; i++)
                          	vSum += Array[i];
                  
                  	if(Length != 0)
                  		for(i = 0; i < Length; i++)
                  			SumSqr += (Array[i] - vSum / Length) * (Array[i] - vSum / Length);
                  
                  	StdDev = Math.sqrt(SumSqr / Length);
                  	return StdDev;
                  }
                  
                  function LinearReg(Array,Length,Type,TargetB){
                  	var i = 0, num1 = 0, num2 = 0, SumBars = 0, SumSqrBars = 0, SumY = 0, Sum1 = 0, Sum2 = 0, Slope = 0, Intercept = 0;
                  
                  	if(Length == 0)
                  		return 0;
                  	
                  	SumBars = Length * (Length - 1) * .5;
                  	SumSqrBars = (Length - 1) * Length * (2 * Length - 1) / 6;
                  	
                  	Sum1 = 0;
                  	for(i = 0; i < Length; i++){
                  		Sum1 += i * Array[i];
                  		SumY += Array[i];
                  	}
                  	Sum2 = SumBars * SumY;
                  	Num1 = Length * Sum1 - Sum2;
                  	Num2 = SumBars * SumBars - Length * SumSqrBars;
                  
                  	if(Num2 != 0)
                  		Slope = Num1 / Num2;
                  	else 
                  		Slope = 0;
                  	if(Type == "AngleFC")
                  		return Math.atan(Slope); 
                  	else if(Type == "Slope")
                  		return Slope; 
                  	else if(Type == "Value"){
                  		Intercept = (SumY - Slope * SumBars) / Length;
                  		return Intercept + Slope * (Length - 1 - TargetB);
                  	}
                  }
                  Last edited by TS Support; 08-11-2003, 06:48 AM.

                  Comment


                  • #99
                    :: wavetrader ::

                    You can download modified version of Demand Index here:

                    http://share.esignal.com/download.js...emandIndex.efs
                    Last edited by TS Support; 08-14-2003, 11:20 AM.

                    Comment


                    • ## EFS Study

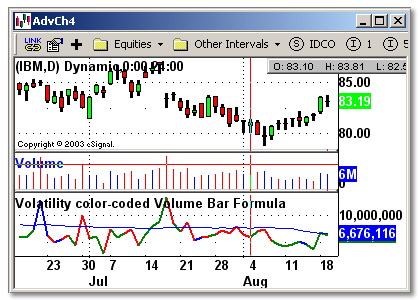
                      Our next study is an indicator created as addition for FVE (Finite Volume Elements) indicator.

                      Volume Based > FVE Volatility color-coded Volume bar [eSignal EFS Indicators]

                      Download: http://share.esignal.com/download.js...BarFormula.efs

                      Category: Indicator

                      Description:

                      The FVE is a pure volume indicator. Unlike most of the other indicators (except OBV), price change doesn’t come into the equation for the FVE (price is not multiplied by volume), but is only used to determine whether money is flowing in or out of the stock. This is contrary to the current trend in the design of modern money flow indicators. The author decided against a price-volume indicator for the following reasons:

                      - A pure volume indicator has more power to contradict.
                      - The number of buyers or sellers (which is assessed by volume) will be the same, regardless of the price fluctuation.
                      - Price-volume indicators tend to spike excessively at breakouts or breakdowns.

                      This study is an addition to FVE indicator. Indicator plots different-coloured volume bars depending on volatility.


                      Inputs:

                      AvgLength - number of bars to calculate
                      AlertPct - alert percent
                      UpColor - upvolume color
                      DownColor - downvolume color
                      NeutralColor - neutral volume color

                      EFS Code:

                      Code:
                      /*******************************************************************
                      Description	: This Indicator plots the Volatility color-coded Volume bar FVE formula
                      Provided By	: TS Support, LLC for eSignal
                      ********************************************************************/
                      
                      function preMain(){
                          setStudyTitle("Volatility color-coded Volume Bar Formula");
                          setCursorLabelName("VBF",0);
                          setDefaultBarFgColor(Color.green,0);
                          setCursorLabelName("VBF EMA",1);
                          setDefaultBarFgColor(Color.blue,1);
                          setDefaultBarThickness(2);
                          setComputeOnClose();
                      }
                      
                      var VMA = null;
                      var EMA_1 = 0;
                      VolumePlusMinusArray = new Array();
                      
                      function main(AvgLength,AlertPct,Cintra,Cinter,Samples){
                      	if(AvgLength == null)
                      		AvgLength = 50;
                      	if(AlertPct == null)
                      		AlertPct = 70;
                      	if(Cintra == null)
                      		Cintra = .1;
                      	if(Cinter == null)
                      		Cinter = .1;
                      	if(Samples== null)
                      		Samples= 22;
                      	if(VMA == null)
                      		 VMA = new MAStudy(AvgLength, 0, "Volume", MAStudy.SIMPLE);
                      	
                      	var TP = 0, TP1 = 0,  MF = 0, Intra = 0, Inter = 0, Vintra = 0, Vinter = 0, CutOff = 0, i = 0;
                      	
                      	IntraArray = new Array();
                      	InterArray = new Array();
                      		
                      	for(i = 0; i < Samples; i++){
                      		IntraArray[i] = Math.log(high(-i)) - Math.log(low(-i));
                      		InterArray[i] = Math.log((high(-i) + low(-i) + close(-i))/3) - Math.log((high(-i-1)+ low(-i-1) + close(-i-1))/3);
                      	}
                      	
                      	TP = (high() + low() + close())/3;
                      	TP1 = (high(-1)+ low(-1) + close(-1))/3;
                      	
                      	Intra = Math.log(high()) - Math.log(low());
                      	Vintra = StandardDev(IntraArray,Samples);
                      	Inter = Math.log(TP) - Math.log(TP1);
                      	Vinter = StandardDev(InterArray,Samples);
                      	CutOff = Cintra * Vintra + Cinter * Vinter;	
                      	MF = (close() - (high() + low())/2)+ TP - TP1;
                      
                      	if(MF > CutOff * close())
                      		setBarFgColor(Color.green);
                      	else if(MF < -1 * CutOff * close())
                      		setBarFgColor(Color.red);
                      	else
                      		setBarFgColor(Color.blue);
                      		
                      	return new Array(volume(),VMA.getValue(MAStudy.MA));		
                      }
                      
                      function StandardDev(Array,Length){
                      	var i;
                      	var vSum = 0;
                      	var SumSqr = 0;
                      	var StdDev = 0;
                      	
                      	for(i = 0; i < Length; i++)
                              	vSum += Array[i];
                      
                      	if(Length != 0)
                      		for(i = 0; i < Length; i++)
                      			SumSqr += (Array[i] - vSum / Length) * (Array[i] - vSum / Length);
                      
                      	StdDev = Math.sqrt(SumSqr / Length);
                      	return StdDev;
                      }

                      Comment


                      • EFS Study ##

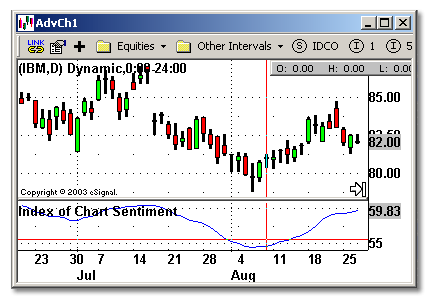
                        Our next study is the Index Of Market Sentiment indicator by Viktor Likhovidov.

                        Volume Based > [eSignal EFS Indicators]

                        Download: http://share.esignal.com/download.js...r&file=ICS.efs
                        Download: http://share.esignal.com/download.js...likhovidov.efs

                        Category: Indicator > Trend Identificator

                        Description:

                        The main problem of technical indicators is the identifying a trend in its early stages.

                        To effectively do this, Mr. Likhovidov created an indicator called the Index of Chart Sentiment (ICS). The ICS could reach very high levels and this corresponds to an overbought market; very low values of the index correspond to an oversold market. When the index moves from lower to higher levels (period of bullish sentiment of the market) the dominant movement of the chart should be to the upside.

                        The algorithm for calculating the CandleCode involves a long-period analysis of the chart. But this analysis does not consist of the usual smoothing and therefore does not result in any lag.

                        To fing more information please refer Index Of Chart Sentiment article by Viktor Likhovidov in recent S&C issue.

                        Note: You MUST have both ICS.efs & bb_likhovidov.efs files in the same folder.


                        Inputs:

                        BBlength - number of bars to calculate BB
                        Deviations - number of StdDev to use

                        EFS Code:

                        Code:
                        /*******************************************************************
                        Description	: This Indicator plots the Index of Chart Sentiment
                        Provided By	: TS Support, LLC for eSignal
                        ********************************************************************/
                        
                        function preMain(){
                        	setStudyTitle("Index of Chart Sentiment");
                        	setCursorLabelName("ICS",0);
                        	setDefaultBarFgColor(Color.blue,0);
                        	setComputeOnClose();
                        }
                        
                        
                        var EMA1_1 = 0;
                        var EMA2_1 = 0;
                        
                        function main(BBlength,Deviations) {
                        	if(BBlength == null)
                        		BBlength = 55
                        	if(Deviations == null)
                        		Deviations = .5
                        	
                        	var i = 0, Body = 0, ThBot_Body = 0, ThTop_Body = 0, ThBot_Ushd = 0, ThTop_Ushd = 0,
                        	    ThBot_Lshd = 0, ThTop_Lshd = 0, ColorCode = 0, BodyCode = 0, UshdCode = 0, LshdCode = 0,
                        	    BBTop = 1, BBBot = -1, EMA1 = 0, EMA2 = 0;
                        	
                        	Body = Math.abs(open() - close());
                        	UpperShadow = high() - Math.max(open(),close());
                        	LowerShadow = Math.min(open(),close()) - low();
                        	
                        	BodyArray = new Array();
                        	UpperShadowArray = new Array();
                        	LowerShadowArray = new Array();
                        	CandleCodeArray = new Array();
                        	
                        	for(i = 0; i < BBlength; i++){
                        		BodyArray[i] = Math.abs(open(-i) - close(-i));
                        		UpperShadowArray[i] = high(-i) - Math.max(open(-i),close(-i));
                        		LowerShadowArray[i] = Math.min(open(-i),close(-i)) - low(-i);
                        	}
                        	
                        	ThTop_Body = callFunction("bb.efs", "main", BBlength, Deviations, BodyArray, BBTop);
                        	ThBot_Body = callFunction("bb.efs", "main", BBlength, Deviations, BodyArray, BBBot);
                        	ThTop_Ushd = callFunction("bb.efs", "main", BBlength, Deviations, UpperShadowArray, BBTop);
                        	ThBot_Ushd = callFunction("bb.efs", "main", BBlength, Deviations, UpperShadowArray, BBBot);
                        	ThTop_Lshd = callFunction("bb.efs", "main", BBlength, Deviations, LowerShadowArray, BBTop);
                        	ThBot_Lshd = callFunction("bb.efs", "main", BBlength, Deviations, LowerShadowArray, BBBot);
                        	
                        	if(close() >= open()){
                        		ColorCode = 64;
                        		if(open() == close())
                        			BodyCode = 0;
                               		else if(Body < ThBot_Body)
                               			BodyCode = 16;
                               		else if(Body < ThTop_Body)
                               			BodyCode = 32;
                           		else
                                        	BodyCode = 48;
                          	}
                        	else{
                        		ColorCode = 0;
                        		if(Body < ThBot_Body)
                                       		BodyCode = 32;
                        		else if(Body < ThTop_Body)
                                       		BodyCode = 16;
                            		else
                                      		BodyCode = 0;
                        	}
                        	if(UpperShadow == 0)
                             		UshdCode = 0;
                           	else if(UpperShadow < ThBot_Ushd)
                                	UshdCode = 4;
                           	else if(UpperShadow < ThTop_Ushd)
                                	UshdCode = 8;
                        	else
                        		UshdCode = 12;
                        
                        	if(LowerShadow == 0)
                              		LshdCode = 3;
                              	else if(LowerShadow < ThBot_Lshd)
                              		LshdCode = 2;
                              	else if(LowerShadow < ThTop_Lshd)
                              		LshdCode = 1;
                        	else
                        		LshdCode = 0;
                        
                        	CandleCode = ColorCode + BodyCode + UshdCode + LshdCode;
                        
                            	EMA1 = 2/25 * CandleCode + 23/25 * EMA1_1;
                            	EMA2 = 2/25 * EMA1 + 23/25 * EMA2_1;
                        	if (getBarState() == BARSTATE_NEWBAR){
                            		EMA1_1 = EMA1;
                            		EMA2_1 = EMA2;
                            	}
                            
                        	return EMA2;
                        }

                        Comment


                        • New EFS Study

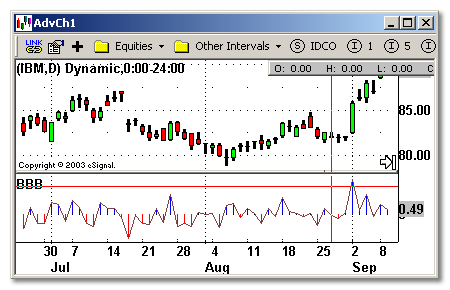
                          Our next study is the Bull And Bear Balance Indicator by Vadim Gimelfarb.

                          Volume Based > [eSignal EFS Indicators]

                          Download: http://share.esignal.com/download.js...c&file=bbb.efs
                          Download: http://share.esignal.com/download.js...bear_power.efs
                          Download: http://share.esignal.com/download.js...bull_power.efs

                          Category: Indicator > Miscellaneous

                          Description:

                          This new indicator analyzes the balance between bullish and bearish sentiment.

                          One can cay that it is an improved analogue of Elder Ray indicator.

                          To get more information please see "Bull And Bear Balance Indicator" by Vadim Gimelfarb in S&C magazine.

                          NOTE. Put ALL 3 efs files into the same directory!


                          No Inputs

                          EFS Code:

                          PHP Code:

                          /*******************************************************************
                          Description    : This Study Plots Bull and Bear Balance Indicator (Bull Power - Bear Power)
                          Provided By    : TS Support, LLC for eSignal
                          ********************************************************************/

                          function preMain(){
                              
                          setStudyTitle("BBB");
                              
                          setCursorLabelName("BBB",0);
                              
                          setDefaultBarFgColor(Color.red,0);
                              
                          setDefaultBarFgColor(Color.brown,1);
                              
                          setComputeOnClose();
                              
                          setPlotType(PLOTTYPE_HISTOGRAM,0);
                          }

                          function 
                          main(){
                              var 
                          value 0;
                              
                          value callFunction("bull_power.efs""main") - callFunction("bear_power.efs""main");
                              if(
                          value 0)
                                  
                          setDefaultBarFgColor(Color.red,0);
                              else
                                  
                          setDefaultBarFgColor(Color.blue,0);
                              return new Array(
                          value,value);
                          }

                          /////////////////////////////////////////////////////////////

                          /*******************************************************************
                          Description    : This Study Plots Bull and Bear Balance Indicator (Bear Power)
                          Provided By    : TS Support, LLC for eSignal
                          ********************************************************************/

                          function preMain(){
                              
                          setStudyTitle("BBB Bear Power");
                              
                          setCursorLabelName("Bear Power",0);
                              
                          setDefaultBarFgColor(Color.red,0);
                              
                          setComputeOnClose();
                              
                          setDefaultBarThickness(2);
                          }

                          function 
                          main(){
                              
                              var 
                          value 0;
                              
                              if(
                          close() < open()) 
                                  if(
                          close(-1) > open()) 
                                      
                          value Math.max(close(-1) - open(), high() - low()); 
                                  else  
                                      
                          value high() - low(); 
                              else 
                                  if (
                          close() > open())
                                      if(
                          close(-1) > open())  
                                          
                          value Math.max(close(-1) - low(), high() - close());
                                      else
                                          
                          value Math.max(open() - low(),high() - close()); 
                                  else 
                                      if(
                          high() - close() > close() - low())
                                          if(
                          close(-1) > open())  
                                              
                          value Math.max(close(-1) - open(),high() - low());  
                                          else    
                                              
                          value high() - low();
                                      else 
                                          if(
                          high() - close() < close() - low())
                                              if(
                          close(-1) > open())
                                                  
                          value Math.max(close(-1) - low(),high() - close());
                                              else         
                                                  
                          value open() - low(); 
                                          else
                                              if(
                          close(-1) > open())
                                                  
                          value Math.max(close(-1) - open(),high() - low()); 
                                              else
                                                  if(
                          close(-1) < open())
                                                      
                          value Math.max(open() - low(),high() - close()); 
                                                  else 
                                                      
                          value high() - low();
                              return 
                          value;
                          }

                          /////////////////////////////////////////////////////////////

                          /*******************************************************************
                          Description    : This Study Plots Bull and Bear Balance Indicator (Bull Power)
                          Provided By    : TS Support, LLC for eSignal
                          ********************************************************************/

                          function preMain(){
                              
                          setStudyTitle("BBB Bull Power");
                              
                          setCursorLabelName("Bull Power",0);
                              
                          setDefaultBarFgColor(Color.blue,0);
                              
                          setComputeOnClose();
                              
                          setDefaultBarThickness(2);
                          }

                          function 
                          main(){
                              
                              var 
                          value 0;
                              
                              if(
                          close() < open()) 
                                  if(
                          close(-1) < open()) 
                                      
                          value Math.max(high() - close(-1), close() - low()); 
                                  else  
                                      
                          value Math.max(high() - open(), close() - low()); 
                              else 
                                  if (
                          close() > open())
                                      if(
                          close(-1) > open())  
                                          
                          value high() - low();  
                                      else
                                          
                          value Math.max(open() - close(-1),high() - low()); 
                                  else 
                                      if(
                          high() - close() > close() - low())
                                          if(
                          close(-1) < open())  
                                              
                          value Math.max(high() - close(-1),close() - low());  
                                          else    
                                              
                          value high() - open();
                                      else 
                                          if(
                          high() - close() < close() - low())
                                              if(
                          close(-1) > open())
                                                  
                          value high() - low();  
                                              else         
                                                  
                          value Math.max(open() - close(-1),high() - low()); 
                                          else
                                              if(
                          close(-1) > open()) 
                                                  
                          value Math.max(high() - open(),close() - low()); 
                                              else
                                                  if(
                          close(-1) < open())
                                                      
                          value Math.max(open() - close(-1),high() - low()); 
                                                  else 
                                                      
                          value high() - low();
                              return 
                          value;

                          Comment


                          • Historic Volatility

                            This may not be the perfect place to post this question, but here goes anyway.

                            Is there an EFS that creates a line study of the historical volatility of a stock over a alterable period of time? If possible I would like to have a Mov Avg on Hist Vol as well.

                            I can do this in excel following this

                            http://www.futuresource.com/industry/hv.asp

                            I wish I could have it pop up on any chart I am looking at in esig...

                            This has nothing to do with valuation of options other than volatility can be an input in some models.

                            Comment


                            • Compradun
                              You may want to check the Historical Volatility EFS that TS Support has coded and that is available here
                              Alex

                              Comment


                              • MA

                                Thanks Alexis,

                                any thoughts on how to add a moving average to the HV line?

                                Thanks

                                Comment

                                Working...
                                X