Announcement

Collapse
No announcement yet.

EFS Studies

Collapse
This topic is closed.
X
X
 
  • Filter
  • Time
  • Show
Clear All
new posts

  • EFS Studies

    Hi eSignal Community,

    In this topic we intend to publish new EFS Studies with source codes, full descriptions and instructions, several times per week.
    You're invited to ask any questions concerning EFS programming or post your wishes we'll surely take into account ASAP.

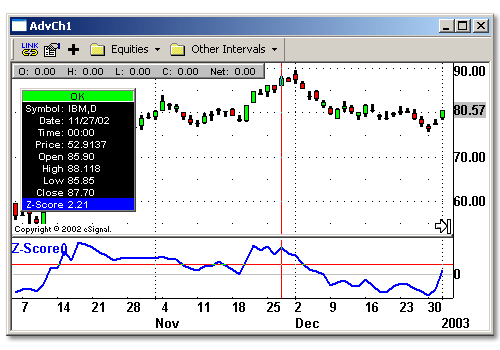
    The first indicator we are publishing is Z-score by Veronique Valcu.

    Miscellaneous > Z-Score [eSignal EFS Indicators]

    Download: http://share.esignal.com/download.js...le=z-score.efs

    Category: Indicator > Miscellaneous

    Description:

    The author of this indicator is Veronique Valcu. The z-score (z) for a data item x measures the distance (in standard deviations StdDev) and direction of the item from its mean (U):


    z = (x-StdDev) / U


    A value of zero indicates that the data item x is equal to the mean U, while positive or negative values show that the data item is above (x>U) or below (x Values of +2 and -2 show that the data item is two standard deviations above or below the chosen mean, respectively, and over 95.5% of all data items are contained within these two horizontal references (see Figure 1).

    We substitute x with the closing price C, the mean U with simple moving average (SMA) of n periods (n), and StdDev with the standard deviation of closing prices for n periods, the above formula becomes:


    Z–score = (C – SMA(n)) / StdDev(C,n)


    The z-score indicator is not new, but its use can be seen as a supplement to Bollinger bands. It offers a simple way to assess the position of the price vis-a-vis its resistance and support levels expressed by the Bollinger Bands. In addition, crossings of z-score averages may signal the start or the end of a tradable trend. Traders may take a step further and look for stronger signals by identifying common crossing points of z-score, its average, and average of average.


    Inputs:

    Period - number of bars to use in calculation

    EFS Code:

    Code:
    /*************************************************
    Desctiption: Z-Score Indicator by Veronique Valcu 
    Provided by: TS Support, LLC for eSignal. (c) Copyright 2002  
    *************************************************/
    
    var ma = null;
    
    function preMain()
    {
        setStudyTitle("Z-Score");
        setCursorLabelName("Z-Score", 0);
        setDefaultBarFgColor(Color.red, 0);
        addBand(0, PS_SOLID, 1, Color.lightgrey);
    }
    
    function main(Period) {
    	var StdDev = 0;
    	var SumSqr = 0;
    	var counter = 0;
    	
    	if(Period == null)
    		Period = 20;
    	
    	if(ma == null)
    		ma = new MAStudy(Period, 0, "Close", MAStudy.SIMPLE);
    	
    	for(counter = - Period + 1; counter <= 0; counter++)
    		SumSqr += Math.pow((close(counter) - ma.getValue(MAStudy.MA)),2);
    	
    	StdDev = Math.sqrt(SumSqr / Period);
    	
    	return (close() -  ma.getValue(MAStudy.MA)) / StdDev;
    }
    Last edited by TS Support; 01-09-2003, 12:35 PM.

  • #2
    Hi,

    This is a great idea!
    Can people post requests for specific formulas?
    Also, do you know if there is a repository online for the eSignal formula's from the S&C magazine?

    Thanks!
    Garth

    Comment


    • #3
      Hi,

      Yes eSignal customers can post the requests here and we'll code requested formulas as far as possible. As to the S&C studies we can post all S&C EFS studies first of all if desired.

      With kind regards,
      Robert

      PS
      [img ] tag doesn't work. Any ideas?
      Last edited by TS Support; 01-09-2003, 12:48 PM.

      Comment


      • #4
        Hi,

        I think it would be great to start with the S&C efs formula's first, if they are not already archieved online as a collection elsewhere.
        Garth

        Comment


        • #5
          Encapsulated bars

          Robert
          Here goes with one user request.
          Would it be possible to have a study that does what is shown in the attachment?
          In the sample image the plot is daily with weekly encapsulation, but I can do the same also with other time frames (for example 1 min bars and 3 or 5 min encapsulation).
          As an aside the program I do this with is not Fibonacci Trader.
          The one thing that is very important is to make sure that the bars and the encapsulation are always in sync with each other and fall on to the appropriate times. Notice in fact that there are some weeks where there are only 3 or 4 days, yet that does not throw off the encapsulation. In other words it should not be a simple bar count.
          Also important is that the encapsulation is created as new bars are added - as you can see in the last week - and that the values of the High and Low of the encapsulating interval are reported in a Cursor Window.
          Thanks in advance for anything you can do
          Alex
          Attached Files

          Comment


          • #6
            Following up on my prior message/request.

            If the encapsulation could not be done as shown in the image ie a line that wraps the week a lightly shaded area that fills the same space could be an alternative.
            TIA

            Alex

            Comment


            • #7
              EFS Studies # 2

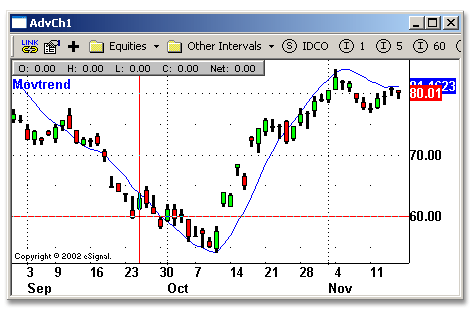
              Our next indicator is Moving Trend by William Rafter.

              Miscellaneous > Moving Trend [eSignal EFS Indicators]

              Download: http://share.esignal.com/download.js...ile=rafter.efs

              Category: Indicator > Trend Identificator

              Description:

              This is a very useful zero-lag trend identificator created by William Rafter.

              The moving trend is not a moving average (where the coefficients are positive and add up to one), nor is it an oscillator where the coefficients add up to zero). It`s a dataset having properties of both and this hybrid nature is what minimizes lag.

              This indicator is calculated using "Weighted Values" technique, the weights are found as follows:

              1) take the numbers 1,2,3.., n
              2) subtract (n + 1)/3
              3) multiply by 6/n(n + 1)

              To get more information on this indicator, please read Rafter`s article in 01/2003 issue of S&C magazine.


              Inputs:

              n - number of bars to calculate

              EFS Code:

              Code:
              /*******************************************************************
              Provided By	: TS Support, LLC for eSignal. (c) Copyright 2002  
              ********************************************************************/
              
              function preMain()
              {
                  setStudyTitle("Movtrend");
                  setCursorLabelName("Movtrend", 0);
                  setDefaultBarFgColor(Color.blue, 0);
                  setPriceStudy(true);
              
              }
              
              function main(n) {
              	if(n == null)
              		n = 20;
              	var sum = 0;
              	var i = 0;
              	var mt = 0;
              	
              	for(i = n; i > 0; i--)
              		sum += (i - (n + 1) / 3) * close(i - n);
              	wt = 6 / (n * (n + 1)) * sum
              	return wt;
              }

              Comment


              • #8
                EFS Studies #3

                Our next indicator is Fisher Transform Indicator by Ehler.

                Cycle Analysis > Fisher Transform Indicator by Ehlers [eSignal EFS Indicators]

                Download: http://share.esignal.com/download.js...ile=fisher.efs

                Category: Indicator > Cycle Analysis

                Description:

                Market prices do not have a Gaussian probability density function as many traders think. Their probability curve is not bell-shaped. But trader can create a nearly Gaussian PDF for prices by normalizing them or creating a normalized indicator such as the relative strength index and applying the Fisher transform. Such a transformed output creates the peak swings as relatively rare events.

                Fisher transform formula is: y = 0.5 * ln ((1+x)/(1-x))

                The sharp turning points of these peak swings clearly and unambiguously identify price reversals in a timely manner.

                If the prices are normalized to fall within the range from -1 to +1 and subjected to the Fisher transform, the extreme price movements are relatively rare events. This means the turning points can be clearly identified.

                To get more information on this indicator, please read Using The Fisher Transform article by J.Ehlers in 11/2002 issue of S&C magazine.


                Inputs:

                Len - number of bars to use in calculation

                EFS Code:

                Code:
                /*******************************************************************
                Description : This Indicator plots Fisher Transform Indicator 
                Provided By : Developed by TS Support, LLC for eSignal. (c) 
                Copyright 2002
                ********************************************************************/
                
                function preMain()
                
                {
                    setStudyTitle("Ehlers");
                    setCursorLabelName("Fisher", 0);
                    setCursorLabelName("Trigger", 1);
                    setDefaultBarFgColor(Color.red, 0);
                    setDefaultBarFgColor(Color.black, 1);
                }
                
                var Value1_1 = 0;
                var Fish_1 = 0
                
                function main(Len) {
                	if (Len == null) 
                		Len = 10;
                	
                	var Price = (high() + low()) / 2;
                	var MaxH = 0;
                	var MinL = 0;
                	var Fish = 0;
                	var i;
                	var Value1 = 0;
                	var temp;
                	setBarThickness(2,0);	
                    	setBarThickness(2,1);	
                	for(i = 0; i < Len; i++)
                        	if(i == 0){
                			MaxH = high();
                			MinL = low()
                		}
                	        else{
                			MaxH = Math.max(MaxH, high(-i));
                			MinL = Math.min(MinL, low(-i));
                		}
                	
                	Value1 = .33 * 2 * ((Price - MinL) / (MaxH - MinL) - .5) + .67 * Value1_1;
                	
                	if(Value1 > .99)
                		Value1 = .999;
                	if(Value1 < -.99)
                		Value1 = -.999;
                	
                	Fish = .5 * Math.log((1 + Value1) / (1 - Value1)) + .5 * Fish_1;
                	
                	Value1_1 = Value1;
                	if(getBarState() == BARSTATE_NEWBAR) {
                		temp = Fish_1;
                		Fish_1 = Fish;
                	}
                
                	return new Array(Fish,temp);
                }

                Comment


                • #9
                  EFS Studies #4

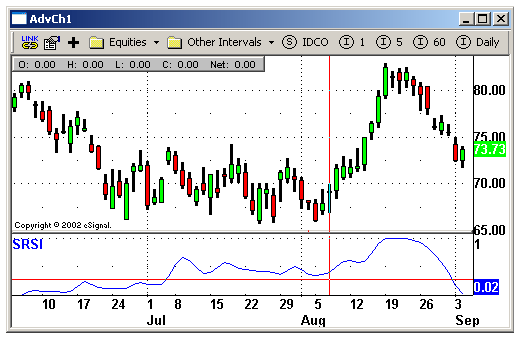
                  Our next indicator is Smoothed RSI by Ehler.

                  Oscillators > SRSI (Smoothed RSI) [eSignal EFS Indicators]

                  Download: http://share.esignal.com/download.js...moothedRSI.efs

                  Category: Indicator > Oscillators

                  Description:

                  This is new version of RSI oscillator indicator, developed by John Ehlers. The main advantage of his way of enhancing the RSI indicator is smoothing with minimum of lag penalty.

                  J.Welles, the original RSI author defined it as:

                  RSI = 100 – [100 / (1 + RS)]

                  where RS = (closes up) / (closes down), or RS = CU / CD

                  In another words RSI = 100 CU / CU + CD

                  So, RSI is the percentage of the sum of the delta closes up to the sum of all the delta closes over the observation period. The only variable is the observation period. For maximum effectiveness, the observation period should be half of the measured dominant cycle length. If the observation period is half the dominant cycle, then for a pure sine wave, the total of closes up is exactly equal to the total closes during the part of the cycle from the valley to the peak. In this case, the RSI would have a value of 100. During another part of the cycle — the next half-cycle — there would be no closes up. During this half-cycle the RSI would have a value of zero. So, in principle, half the measured cycle is the correct choice for the RSI observation period.

                  So the smoothing trick should be applied before the RSI function is computed. Not only are the short-term variations removed, but the desirable shape of the indicator is enhanced with help of so called FIR filters.

                  FIR (finite impulse response) filters such as SMA (simple moving average) produce the same lag for all frequency components in the smoothed waveform. For an N-length FIR filter the amount of lag is (N – 1)/2. For example, a three-bar SMA would have a lag of exactly one bar for all frequency components in its smoothed output, and a twobar SMA would have a lag of only half a bar.

                  To get more information on this indicator, please read The RSI Smoothed article by J.Ehlers in 10/2002 issue of S&C magazine.


                  Inputs:

                  Len - number of bars to calculate

                  EFS Code:

                  Code:
                  /******************************************************************************************
                  Description: This Indicator plots SmoothedRSI indicator 
                  Provided By: eSignal, a division of Interactive Data Corporation. Copyright © 2002   
                  ******************************************************************************************/
                  
                  function preMain() {
                  	setPriceStudy(false);
                  	setStudyTitle("SRSI");
                  	setCursorLabelName("SRSI", 0);
                  	setDefaultBarFgColor(Color.blue, 0);
                  }
                  
                  Smooth23 = new Array();
                  
                  function main(Len) {
                  	if (Len == null)
                  		Len = 10;
                      
                  	var count = 0;
                  	var CU23 = 0;
                  	var CD23 = 0;
                  	var SRSI = 0;
                  	var i = 0;
                  
                  	if (getBarState() == BARSTATE_NEWBAR){
                  		for(i = Len - 1; i > 0; i--)
                  			Smooth23[i] = Smooth23[i - 1];
                  		Smooth23[0] = ( close() + 2 * close(-1) + 2 * close(-2) + close(-3) ) / 6;
                  	}
                  	CU23 = 0;
                  	CD23 = 0;
                  	for(i = 0; i < Len - 1; i++){
                  		if(Smooth23[i] > Smooth23[i + 1])
                  			CU23 = CU23 + Smooth23[i] - Smooth23[i + 1];
                  		if(Smooth23[i] < Smooth23[i + 1])
                  			CD23 = CD23 + Smooth23[i + 1] - Smooth23[i];
                  	}
                  	if(CU23 + CD23 != 0)
                  		SRSI = CU23/(CU23 + CD23);
                  	return SRSI;
                  
                  }

                  Comment


                  • #10
                    EFS Studies # 5

                    Our next indicator is Laguerre-based Moving Average indicator by J. Ehler.

                    Averages > Laguerre-based Moving Average [eSignal EFS Indicators]

                    Download: http://share.esignal.com/download.js...s&file=fir.efs

                    Category: Indicator > Averages

                    Description:

                    This moving average indicator allows to avoid whipsaw trades and strike a balance between the amount of smoothing and the amount of lag by using some modern math tools like Laguerre transform filter. This filter is the next generation tool comparing to either the usual MovAvg or FIR (finite impulse response) filters.

                    For example, the equation for usual MovAvg will be:

                    Filt = (Price + Price[1] + Price[2] + Price[3]) / 4

                    The equation of the FIR:

                    Filt = (Price + 2*Price[1] + 2*Price[2] + Price[3]) / 6

                    And the equation for Laguerre filter:

                    Filt = (L0 + 2*L1 + 2*L2 + L3) / 6, where:

                    L0 = (1 - gamma)*Price + gamma*L0[1]
                    L1 = -gamma*L0 + L0[1] + gamma*L1[1]
                    L2 = -gamma*L1 + L1[1] + gamma*L2[1]
                    L3 = -gamma*L2 + L2[1] + gamma*L3[1], where "gamma" is damping factor, meant for lag size regulating.


                    Inputs:

                    gamma - damping factor

                    EFS Code:

                    Code:
                    /*******************************************************************
                    Desctiption: Four-Element Laguerre Filter by John Ehlers 
                    Provided by: TS Support, LLC for eSignal. (c) Copyright 2002  
                    ********************************************************************/
                    
                    var ma = null;
                    
                    function preMain()
                    {
                        setPriceStudy(true);
                        setStudyTitle("FIR");
                        setCursorLabelName("Filt", 0);
                        setDefaultBarFgColor(Color.red, 0);
                        setCursorLabelName("FIR", 1);
                        setDefaultBarFgColor(Color.lime, 1);
                    }
                    var L0_1 = 0, L1_1 = 0, L2_1 = 0, L3_1 = 0;
                    function main(gamma) {
                    	if(gamma == null)
                    		gamma = .8;
                    		
                    	var L0 = 0, L1 = 0, L2 = 0, L3 = 0, Filt = 0, FIR = 0, sum = 0, i = 0;
                    
                    	L0 = (1 - gamma) * (high() + low()) / 2 + gamma * L0_1;
                    	L1 = -gamma * L0 + L0_1 + gamma * L1_1;
                    	L2 = -gamma * L1 + L1_1 + gamma * L2_1;
                    	L3 = -gamma * L2 + L2_1 + gamma * L3_1;
                    
                    	Filt = (L0 + 2 * L1 + 2 * L2 + L3) / 6;
                    
                    	for(i = - 3; i <= 0; i++){
                    		if(i == 0 || i == -3)
                    			k = 1;
                    		else
                    			k = 2;
                    		sum += k * (high(i) + low(i)) / 2;
                    	}
                    	FIR = sum / 6;
                    	if (getBarState() == BARSTATE_NEWBAR){
                    		L0_1 = L0;
                    		L1_1 = L1;
                    		L2_1 = L2;
                    		L3_1 = L3;
                    	}
                    	setBarThickness(2);
                    	return new Array(Filt,FIR);
                    }
                    Last edited by TS Support; 01-27-2003, 03:40 AM.

                    Comment


                    • #11
                      EFS Studies # 6

                      Our next indicator is Laguerre-based RSI by J. Ehler.

                      Oscillators > Laguerre-based RSI [eSignal EFS Indicators]

                      Download: http://share.esignal.com/download.js...s&file=rsi.efs

                      Category: Indicator > Oscillators

                      Description:

                      This is RSI indicator which is more sesitive to price changes. It is based upon a modern math tool - Laguerre transform filter.

                      With help of Laguerre filter one becomes able to create superior indicators using very short data lengths as well. The use of shorter data lengths means you can make the indicators more responsive to changes in the price.

                      J. Welles Wilder defined the RSI as RSI = 100 – 100 / (1 + RS),

                      where RS = (Closes Up)/(Closes Down) = CU/CD, and RSI = CU/(CU + CD)

                      In other words, the RSI is the percentage of the sum of the delta closes up to the sum of all the delta closes over the observation period.

                      The equation for Laguerre based RSI will be:

                      L0 = (1 – gamma)*Close + gamma*L0[1];
                      L1 = - gamma *L0 + L0[1] + gamma *L1[1];
                      L2 = - gamma *L1 + L1[1] + gamma *L2[1];
                      L3 = - gamma *L2 + L2[1] + gamma *L3[1];

                      If L0 >= L1 then CU = L0 - L1 Else CD = L1 - L0;
                      If L1 >= L2 then CU = CU + L1 - L2 Else CD = CD + L2 - L1;
                      If L2 >= L3 then CU = CU + L2 - L3 Else CD = CD + L3 - L2;

                      If CU + CD <> 0 then RSI = CU / (CU + CD);

                      A typical use of the Laguerre RSI is to buy after the line crosses back over the 20% level and sell after the price crosses back down over the 80% level. Of course, just as with the conventional RSI, more elaborate trading rules can be created.


                      Inputs:

                      gamma - damping factor

                      EFS Code:

                      Code:
                      /*******************************************************************
                      Desctiption: RSI Laguerre Indicator by John Ehlers 
                      Provided by: TS Support, LLC for eSignal. (c) Copyright 2002  
                      ********************************************************************/
                      
                      function preMain()
                      {
                          setStudyTitle("RSI");
                          setCursorLabelName("RSI", 0);
                          setDefaultBarFgColor(Color.red, 0);
                          addBand(.2, PS_SOLID, 1, Color.lightgrey);
                          addBand(.8, PS_SOLID, 1, Color.lightgrey);
                      
                      }
                      var L0_1 = 0, L1_1 = 0, L2_1 = 0, L3_1 = 0;
                      function main(gamma) {
                      	if(gamma == null)
                      		gamma = .5;
                      		
                      	var L0 = 0, L1 = 0, L2 = 0, L3 = 0, CU = 0, CD = 0, RSI = 0;
                      	L0 = (1 - gamma) * close() + gamma * L0_1;
                      	L1 = - gamma * L0 + L0_1 + gamma * L1_1;
                      	L2 = - gamma * L1 + L1_1 + gamma * L2_1;
                      	L3 = - gamma * L2 + L2_1 + gamma * L3_1;
                      	CU = 0;
                      	CD = 0;
                      
                      	if(L0 >= L1)
                      		CU = L0 - L1;
                      	else
                      		CD = L1 - L0;
                      	if(L1 >= L2)
                      		CU = CU + L1 - L2;
                      	else
                      		CD = CD + L2 - L1;
                      	if(L2 >= L3)
                      		CU = CU + L2 - L3
                      	else
                      		CD = CD + L3 - L2;
                      	if(CU + CD != 0)
                      		RSI = CU / (CU + CD);
                      	
                      	if (getBarState() == BARSTATE_NEWBAR){
                      		L0_1 = L0;
                      		L1_1 = L1;
                      		L2_1 = L2;
                      		L3_1 = L3;
                      	}
                      	setBarThickness(2);
                      	return RSI;
                      }

                      Comment


                      • #12
                        EFS Studies # 7

                        Our next indicator is The Center Of Gravity.

                        Oscillators > The Center Of Gravity [eSignal EFS Indicators]

                        Download: http://share.esignal.com/download.js...le=Gravity.efs

                        Category: Indicator > Oscillators

                        Description:

                        This indicator identifies every major turning point without much lag. This indicator is computed in a similiar way to the Ehlers filter. The position of the balance point is the summation of the product of position within the observation window multiplied by the price at that position divided by the summation of prices across the window. The formula is:

                        CG = SUM(x+1) * Price(i) / SUMPrice(i)

                        In this formula "1" is added to the position count because it starts with the most recent price at zero, and multiplying the most recent price by that position count would remove it from the computation.


                        Inputs:

                        Length - number of bars to calculate

                        EFS Code:

                        Code:
                        /*******************************************************************
                        Description	: This Indicator plots Gravity oscillator
                        Provided By	: Developed by TS Support, LLC for eSignal. (c) Copyright 2002 
                        ********************************************************************/
                        
                        
                        function preMain() {
                        	
                        	setStudyTitle("Center of Gravity Oscillator");
                        	setPriceStudy(false);
                        	setDefaultBarFgColor(Color.red, 1);
                        	setDefaultBarFgColor(Color.blue, 0);
                        
                        }
                        var cg_1 = 0;
                        
                        function main(Length) {
                            if(Length == null)
                                Length = 10;
                        
                            var count = 0;
                            var num = 0;
                            var cg;
                            var temp;
                            var denom = 0;
                            var vHigh = getValue("high", 0, -Length);
                            var vLow = getValue("low", 0, -Length);
                         
                        
                            if(vHigh == null || vLow == null) {
                                return;
                            }
                        
                            for(count = 0; count < Length - 1; count++) {
                                num += (1 + count) * ((vHigh[count] + vLow[count])/2);
                                denom += (vHigh[count] + vLow[count])/2;
                            }
                        
                            if(denom != 0)
                            	cg = - num/denom;
                            
                            temp = cg_1;
                            if (getBarState() == BARSTATE_NEWBAR)  
                            	cg_1 = cg;    
                          	
                            return new Array(cg,temp);
                            
                        }
                        
                          /*
                        Inputs:  Price((H+L)/2), 
                                 Length(10); 
                        
                        Vars:  count(0), 
                               Num(0), 
                               Denom(0), 
                               CG(0); 
                        	Num=0; 
                        	Denom=0; 
                        
                        For count=0 to Length-1 begin 
                          Num=Num+(1+count)*(Price[count]); 
                          Denom=Denom+(Price[count]); 
                        End; 
                        
                        If Denom<>0 then CG=-Num/Denom; 
                        
                        Plot1(CG,"CG"); 
                        
                        Plot2(CG[1],"CG1"); 
                        */

                        Comment


                        • #13
                          EFS Studies /Formulaes

                          Hi

                          Could I have the following varaibles added to the Moving Average EFS.

                          I would like to have as an additional variable the period on which the MA is to be calculated. (For eg if I have a dialy chart then this study allows me to define a period of say 1 hour and be able to draw a moving average based on that. Also I could use the study again to draw a MA with a period greater than 1 day.etc)

                          Hence I would be able to use the existing offset and colour change variables as well.

                          Thanks

                          Comment


                          • #14
                            EFS Studies # 8

                            Our next indicator is Trend Intensity Index.

                            Trend Identificator > Trend Intensity Index [eSignal EFS Indicators]

                            Download: http://share.esignal.com/download.js...r&file=TII.efs

                            Category: Indicator > Trend Identificator

                            Description:

                            The Trend Intensity Index indicator is used to indicate the strength of a current trend in the market. The stronger the trend, the more likely the market will continue moving in this direction insetad of changing course.

                            The indicator is calculated according to this formula:

                            TII = (SD+)/((SD+)+(SD-))*100,

                            where:

                            SD+ = SUM of UP deviations o fthe last 30 days
                            SD- = SUM of DOWN deviations o fthe last 30 days

                            The meaning of the indicator fluctuates from 0 to 100.

                            To get more information on this indicator, please read Trend Intensity Index article by M.H. Pee in 06/2002 issue of S&C magazine.


                            No Inputs

                            EFS Code:

                            Code:
                            /*******************************************************************
                            Description : This Indicator plots Trend Intensity Index indicator
                            Provided By : Developed by TS Support, LLC for eSignal. (c) Copyright 2002
                            ********************************************************************/
                            
                            function preMain() {
                            
                            	setStudyTitle("Trend Intensity Index");
                            	setCursorLabelName("TII");
                            	setStudyMin(-1);
                            	setStudyMax(101);
                            	
                            	addBand(20, PS_SOLID, 1, Color.black);
                            	addBand(80, PS_SOLID, 1, Color.black);
                            }
                            
                            var nLengthMA = 60;
                            var nLengthTII = 30;
                            
                            function main() {
                            	var vMA = call("/Library/MA.efs", nLengthMA);
                            
                            	var arC = close(0, -nLengthTII);
                            	if(arC == null)
                            		return;
                            
                            	var i;
                            	var dSDP = 0, dSDM = 0;
                            
                            	for(i = 0; i < nLengthTII; i++) {
                            	if(arC[i] > vMA) {
                            		dSDP +=arC[i] - vMA;
                            	} else if(arC[i] < vMA) {
                            		dSDM += vMA - arC[i];
                            	}
                            	}
                            
                            	return (dSDP / (dSDP + dSDM)) * 100;
                            }

                            Comment


                            • #15
                              Stochastic with EMA instead of SMA

                              Could I make a request for a 3 variable stochastic

                              Stochastic(14(3),3) as the current one but with an EMA instead of an SMA.
                              It is slightly slower than the SMA.

                              StochasticSMA(14(3),1) = StochasticEMA(14(3),1)

                              but after this it gets EMA'd.

                              I tried writting this and it takes ages to load.
                              Mine is significantly slower than the current SMA implementation

                              thx

                              macavity

                              Comment

                              Working...
                              X