 Tweet
Tweet
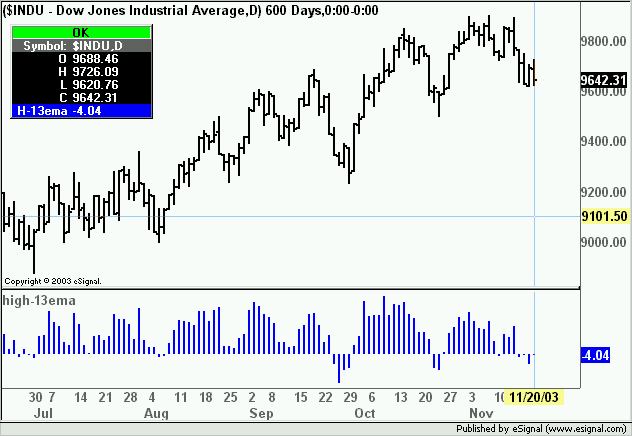
All I need to do is to create a histogram oh the high minus a 13 EMA of the close. Help, please...
-
-
lassiter
The attached efs should do what you asked
Alex
-
Alex, et al
I am intrigued by this efs. I am attempting to take it one step further:
if the (OHLC)>13sma return high()-sma13
if the (OHLC<13sma return low()-sma13
can you help?
Also, I am interested in having the sma a variable to edit.
I am attaching what I have done so far, but it is not working out.
Please help anyone.
Thanks,
EZComment
-
And to further the quest to work this out, I wanted to have the histogram change colors.
Attached is my first attempt that, guess what, does not work.
Thanks in advance for any help.
EZComment
-
EZ
The attached efs should do what you asked in the first message.
Once you have checked it out it can then be enhanced by adding the conditions for painting the bars.
AlexComment
Comment