Announcement

Collapse
No announcement yet.

Highest & Lowest on the screen

Collapse
X
 
  • Filter
  • Time
  • Show
Clear All
new posts

  • Highest & Lowest on the screen

    Hi all,

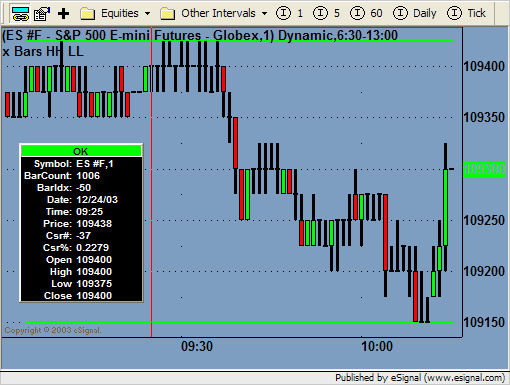
    Is there a way to get the highest high and lowest low of the bars which are displayed on the screen?

    Thanks in advance

  • #2
    Hello Balligil,

    EFS doesn’t have a method for determining the number of bars displayed on a chart. Not sure if this is possible, but you are more than welcome to submit a suggestion to development at [email protected].
    Jason K.
    Project Manager
    eSignal - an Interactive Data company

    EFS KnowledgeBase
    JavaScript for EFS Video Series
    EFS Beginner Tutorial Series
    EFS Glossary
    Custom EFS Development Policy

    New User Orientation

    Comment


    • #3
      Jason,

      This isn't strictly true. There is getOldestBarIndex(), which is the same as getting the number of bars in the chart.

      What I do for this case if wait for the current bar index to == 0 then I do a loop from 0 to getOldestBarIndex() using conditionals to save the current highest high or lowest low.


      PHP Code:

      If (getCurrentBarIndex() != 0){
         return;
      }

      for (
      getOldestBarIndex(); == 0i++){
            if (
      high(i) > nhighestHi){
               
      nHighestHi high(i);
            if (
      low(i) < nlowestLo){
               
      nLowestLo low(i);

      Hope this helps...it should be 90% of the code you need.

      Garth
      Garth

      Comment


      • #4
        Hi Garth,

        My understanding of what Balligil is asking for is to get the number of bars that are visible in the chart window, not the total number of bars loaded in the chart. Perhaps Balligil can clarify for us.
        Jason K.
        Project Manager
        eSignal - an Interactive Data company

        EFS KnowledgeBase
        JavaScript for EFS Video Series
        EFS Beginner Tutorial Series
        EFS Glossary
        Custom EFS Development Policy

        New User Orientation

        Comment


        • #5
          Jason,

          Getting clarification would be good. If it is the number of bars displayed I have an idea. Why not create a general ROI function that would look at all bars from where a user first clicks with the mouse to where a user second clicks with the mouse.

          After the generic framework is set up, you could then add the logic for highest high and lowest low, and I'm sure others would use the framework for other studies.

          Then all Balligil would have to do is click on the oldest bar visible on the chart and the newest bar visible on the chart and it is done.

          Garth
          Garth

          Comment


          • #6
            Hi again,

            Thanks to you both for your replies. JasonK is right saying that I want get the number of bars that are visible in the chart window.

            Actually what I am looking for is the max. and min. values of the y-axis scale.

            Thanks again. Have a merry Christmas.

            Comment


            • #7
              Re: Reply to post 'Highest &amp; Lowest on the screen'

              Most of the time, the number of bars on a chart is fixed, so in this case
              the number of bars could be a user entered parameter.

              ----- Original Message -----
              From: <[email protected]>
              To: <[email protected]>
              Sent: Wednesday, December 24, 2003 12:13 PM
              Subject: Reply to post 'Highest & Lowest on the screen'


              > Hello dloomis,
              >
              > ~~~~~~~~~~~~~~~~~~~~~~~~~~~~
              >

              Comment


              • #8
                Hello Balligil,

                I've come up with an idea that should work for you, thanks in part to David and Garth's ideas. This formula I've put together should give you what you want. The only downside to this formula is that it's not automatic. After you apply the formula to your chart, get the bar index of the oldest visible bar in your chart and use that number to get the total number of visible bars in your chart. Make sure you are displaying the Bar Index in your cursor window. If you need to turn that on, just right click on the cursor window and select properties. Once you have the settings you want for the HH and LL lines, they will update as new bars arrive to only show the HH and LL for the last x bars you've specified.

                For example, in the chart below I put the cursor on bar -71. Take 71+1, or 72 and enter that number in "Edit Studies" for the Number of Bars input parameter. There's probably a better way to do this, but this should work just fine. If you have any questions, let me know.

                xBarsHHLL.efs

                Jason K.
                Project Manager
                eSignal - an Interactive Data company

                EFS KnowledgeBase
                JavaScript for EFS Video Series
                EFS Beginner Tutorial Series
                EFS Glossary
                Custom EFS Development Policy

                New User Orientation

                Comment


                • #9
                  Most of the time, the number of bars on a chart is fixed, so in this case
                  True for some traders...not so much for others who change the spacing between bars and grow and shirk charts as the charts become more interesting (or less interesting).

                  I still think ROI tool is the way to go here (until an EFS function is created to give us bars visible).

                  Garth
                  Garth

                  Comment


                  • #10
                    This might be a little easier for the casual reader to comprehend, with the same result.
                    Attached Files

                    Comment


                    • #11
                      David,

                      Is it possible to tweak this efs so that one may be alerted each time a new high as been reached?

                      Cheers

                      Carlton

                      Comment


                      • #12
                        Hi All,

                        Here is a fun version of the script that David modifed. It uses 2x mouse clicks to define where the left most bar to start the High/Low analysis if the user defined number of bars = 0 (now the default). If number of bars is non-zero it will use that to determine the number of bars to the left to use (the way the script was originally modified by David), but mouse clicks will be ignored.

                        This means you can change the size of the chart, or the number of bars displayed in the chart, and quickly adjust the High/Low.

                        Garth
                        Attached Files
                        Garth

                        Comment


                        • #13
                          Garth

                          That was fun, thx for the ideas.

                          I noticed if I click more than nBars to the left, the line drawn for the hi/lo maxes out at nBars. I changed nBars from 20 to 200 and that seemed to clear it up, probably cuz vDonchian doesn't get calculated in line 64, except the first time thru the efs.

                          I commented out line 63 and the effect seems better.

                          Comment


                          • #14
                            David,

                            Thanks for the info. I'll clean it up and repost a new version.

                            Garth
                            Garth

                            Comment

                            Working...
                            X